| Organisms use energy to carry out the functions of life |
| Autotrophs obtain this energy directly from sunlight and store it within organic compounds |
| This energy transfer process is called photosynthesis |
ENERGY FOR LIFE PROCESSES
| Energy is the ability to do work |
| Cellular work includes growth, repair, active transport, synthesis, & reproduction |
| Food made by autotrophs is the source of energy for all other organisms |

5. Most AUTOTROPHS or PRODUCERS use PHOTOSYNTHESIS, to Convert the Energy in SUNLIGHT, CARBON DIOXIDE, AND WATER into Chemical Energy OR FOOD. (GLUCOSE)
6. THE FOODS MADE BY AUTOTROPHS ARE stored in various Organic Compounds, primarily CARBOHYDRATES, including a SIX-CARBON SUGAR called GLUCOSE.
7. Plants, algae, and some prokaryotes (Bacteria) are all types of Autotrophs.
8. Only 10 percent of the Earth’s 40 million species are Autotrophs.
9. Without Autotrophs, all other living things would DIE. Without PRODUCERS you cannot have CONSUMERS.
10. Autotrophs not only make Food for their own use, but STORE a great deal of Food for use by other organisms (CONSUMERS).
11. Most Autotrophs use ENERGY from the SUN to make their food, but there are other organisms deep in the ocean that obtain Energy from INORGANIC COMPOUNDS. (CHEMOSYNTHESIS)
12. Organisms that CANNOT Make their own food are called HETEROTROPHS OR CONSUMERS.
13. Heterotrophs include animals, fungi, and many unicellular organisms, they stay alive by EATING AUTOTROPHS or other HETEROTROPHS.
14. Because Heterotrophs must consume other organisms to get Energy, they are called CONSUMERS.
15. Only part of the energy from the Sun is Used by Autotrophs to make Food, and only part of that Energy can be passed on to other Consumers. A Great Deal of the Energy is LOST as HEAT.
16. Enough Energy is passed from Autotroph to Heterotroph to give the Heterotroph the Energy it needs.
17. Photosynthesis involves a COMPLEX SERIES of Chemical Reactions, in which the PRODUCT of One Reaction is Consumed in the Next Reaction.
18. A Series of Reactions linked in this way is referred to as a BIOCHEMICAL PATHWAY. (Figure 6-1)
19. Autotrophs use biochemical pathways of photosynthesis to manufacture organic compounds from Carbon Dioxide, CO2, and Water. During this conversion, molecular OXYGEN, O2, is Released.
20. Some of the energy stored in organic Compounds is Released by Cells in another set of Biochemical Pathways, Known as CELLULAR RESPIRATION. (Chapter 7)
21. Both Autotrophs and Heterotrophs Perform Cellular Respiration.
22. During Cellular Respiration in Most Organisms, Organic Compounds are Combined with O2 to Produce ADENOSINE TRIPHOSPHATE or ATP, Yielding CO2 and Water as Waste Products.
23. The PRODUCTS of Photosynthesis, ORGANIC COMPOUNDS and O2, are the REACTANTS used in CELLULAR RESPIRATION.
24. The WASTE PRODUCTS of CELLULAR RESPIRATION, CO2 and WATER, are the REACTANTS used in PHOTOSYNTHESIS.
LIGHT ABSORPTION IN CHLOROPLASTS
1. In Plants, the INITIAL REACTIONS in Photosynthesis are known as the LIGHT REACTIONS.
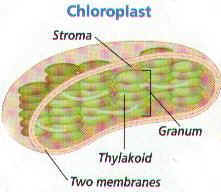 2. They begin with the ABSORPTION of Light in the organelle found in Plant Cells and algae called CHLOROPLASTS.
3. A Photosynthetic Cell contains anywhere from ONE to Several Thousands Chloroplasts.
4. A Chloroplasts is surrounded by TWO MEMBRANES. The INNER Membrane is Folded into many Layers. (Figure 6-2)
5. A Chloroplasts Inner Membrane layers fuse along the edges to Form THYLAKOIDS.
6. THYLAKOIDS ARE DISK-SHAPED STRUCTURES THAT CONTAIN PHOTOSYNTHETIC PIGMENTS.
7. Each Thylakoid is a closed Compartment surrounded by a Central Space. THE THYLAKOIDS ARE SURROUNDED BY A GEL-LIKE MATRIX (SOLUTION) CALLED THE STROMA. (Figure 6-2)
8.THE NEATLY FOLDED THYLAKOIDS THAT RESEMBLE STACKS OF PANCAKES ARE CALLED GRANA. The Thylakoids are Interconnected and are Layered on top of one another to form the STACKS of Grana.
9. Each Chloroplasts may contain hundreds or more Grana.
10. Hundreds of Chlorophyll Molecules and other Pigments in the Grana are organized into PHOTOSYSTEMS.
11. PHOTOSYSTEMS ARE LIGHT COLLECTING UNITS OF CHLOROPLASTS.
LIGHT AND PIGMENTS
1. LIGHT is made of Particles called PHOTONS that move in WAVES.
2. The Distance between peaks of the waves is called WAVELENGTH.
3. Different Wavelengths of Light Carry different amounts of Energy.
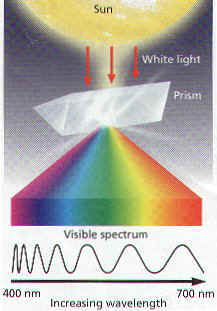 4. Sunlight is visible as White, it is actually a variety of Different Colors.
5. You can separate White Light into its component colors by passing the light through a PRISM.
6. The resulting array of colors, ranging from red at one end to violet at the other is called the VISIBLE SPECTRUM.
7. Each Color of Light has different Wavelengths, and a Different Energy.
8. When light strikes an object, its component colors can be Reflected, Transmitted, or Absorbed by an object.
9. An Object that ABSORBS ALL COLORS appears BLACK.
10. A PIGMENT IS A MOLECULE THAT ABSORBS CERTAIN WAVELENGTHS OF LIGHT AND REFLECTS OR TRANSMITS OTHERS.
11. Objects or Organisms vary in Color because of their specific combination of Pigments.
12. WAVELENGTHS that are REFLECTED by Pigments are SEEN as the object’s COLOR.
CHLOROPLASTS PIGMENTS
 1. Located in the Membrane of the Thylakoids are a variety of Pigments.
2. CHLOROPHYLLS ARE THE MOST COMMON AND IMPORTANT PIGMENTS IN PLANTS AND ALGAE.
3. The TWO most common Types of Chlorophylls are designated Chlorophyll a and Chlorophyll b.
4. A Slight difference in molecular structure between Chlorophyll a and Chlorophyll b causes the Two molecules to Absorb different colors of light.
5. Chlorophyll’s ABSORB VIOLET, BLUE AND RED LIGHT. These are the Wavelengths of Light that Photosynthesis Occurs. (Figure 6-4)
6 Chlorophyll a ABSORBS LESS BLUE Light but MORE RED Light than Chlorophyll b Absorbs.
7. ONLY Chlorophyll a is DIRECTLY INVOLVED in the LIGHT REACTIONS of Photosynthesis. Chlorophyll b ASSISTS Chlorophyll a in Capturing Light Energy and is called an ACCESSORY PIGMENT.
8. By Absorbing colors Chlorophyll a CANNOT Absorb, the Accessory Pigments enable Plants to Capture MORE of the Energy in Light
9. Chlorophylls REFLECT and TRANSMIT GREEN LIGHT, causing Plants to appear GREEN.
10. Another group of Accessory Pigments found in the Thylakoid Membranes, called the CAROTENOIDS, INCLUDES YELLOW, RED, AND ORANGE PIGMENTS THAT COLOR CARROTS, BANANAS, SQUASH, FLOWERS AND AUTUMN LEAVES.
11. The Carotenoids in Green Leaves are usually masked by Chlorophylls until Autumn when Chlorophylls break down.

OVERVIEW OF PHOTOSYNTHESIS
“THE BIG PICTURE”
1. Photosynthesis is the process that provides energy for almost all Life.
2. During Photosynthesis, Autotrophs use the Sun’s Energy to make Carbohydrate Molecules from Water and Carbon Dioxide, Releasing Oxygen as a Byproduct.
3. The Process of PHOTOSYNTHESIS CAN BE SUMMARIZED BY THE FOLLOWING EQUATION:
6CO2 + 6H2O + LIGHT C6H12O2 + 6O2
CARBON WATER ENERGY 6-CARBON OXYGEN
DIOXIDE SUGAR GAS
4. In this equation the Six-Carbon Sugar GLUCOSE and Oxygen are the Products.
5. The Energy Stored in Glucose and other Carbohydrates can be used later to produce ATP during Cellular Respiration.
 6. The Process of Photosynthesis does NOT Happen all at Once; rather it occurs in THREE STAGES:
STAGE 1 – CALLED THE LIGHT DEPENDENT REACTIONS. Energy is Capture from Sunlight. Water is Split into Hydrogen Ions, Electrons, and Oxygen (O2). The O2 Diffuses out of the Chloroplasts (Byproduct).
STAGE 2 – The Light Energy is Converted to Chemical Energy, which is Temporarily Stored in ATP and NADPH.
STAGE 3 – CALLED THE CALVIN CYCLE. The Chemical Energy Stored in ATP and NADPH powers the formation of Organic Compounds (Sugars), Using Carbon Dioxide, CO2.

 7. Photosynthesis occurs in the Chloroplasts of Plant Cells and Algae and in the Cell Membranes of certain Bacteria.
ELECTRON TRANSPORT – LIGHT REACTIONS
1. The Chlorophylls and Carotenoids are grouped in Cluster of a Few Hundred Pigment Molecules in the Thylakoid Membranes.
2. Each Cluster of Pigment Molecules is referred to as a PHOTOSYSTEM. There are Two Types of Photosystems known as PHOTOSYSTEM I AND PHOTOSYSTEM II.
3. Photosystem I and Photosystem II are similar in terms of pigments, but they have Different Roles in the Light reactions.
4. The Light Reactions BEGIN when Accessory Pigment molecules of BOTH Photosystems Absorb Light.
5. By Absorbing Light, those Molecules Acquire some of the Energy that was carried by the Light Waves.
6. In each Photosystem, the Acquired Energy is Passed to other Pigment Molecules until it reaches a Specific Pair of CHLOROPHYLL a Molecules.
7. The Events occur from this point on can be Divided into 5 STEPS. (Refer to Figure 6-5)
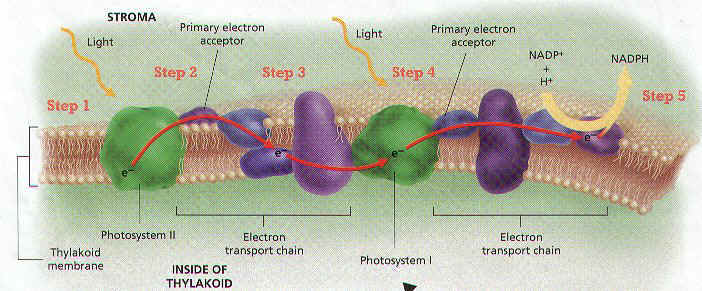
STEP 1 – Light Energy Forces Electrons to enter a Higher Energy Level in the TWO Chlorophyll a Molecules of Photosystem II. These Energized Electrons are said to be “EXCITED”.
STEP 2 – The Excited Electrons have enough Energy to Leave Chlorophyll a Molecules. Because they have lost Electrons, the Chlorophyll a Molecules have undergone an OXIDATION REACTION (lost of Electrons). Each Oxidation Reaction must be accompanied by a REDUCTION REACTION (some substance must Accept the Electrons). The Substance is a Molecule in the Thylakoid Membrane Known as a PRIMARY ELECTRON ACCEPTOR.
STEP 3 – The Primary Electron Acceptor then Donates (gives) the Electrons to the First of a Series of Molecules located in the Thylakoid. This Series of Molecules is called an ELECTRON TRANSPORT CHAIN, because it Transfers Electrons from One Molecule to the Next in Series. As the Electrons are pass from molecule to molecule, they LOSE most of the Energy they acquired when they were Excited. The Energy they LOSE is Harnessed to Move Protons into the Thylakoid.
STEP 4 – At the same time Light is Absorbed by Photosystem II, Light is also Absorbed by Photosystem I. Electrons move from a Pair of Chlorophyll a Molecules in Photosystem I to another Primary electron Acceptor. The electrons that are LOST by these Chlorophyll a Molecules are REPLACED by the Electrons that have passed through the electron Transport Chain from Photosystem II.
STEP 5 – The Primary Electron Acceptor of Photosystem I donates Electrons to different Electron Transport Chain. This Chain brings Electrons to the side of the Thylakoid Membrane that FACES THE STROMA. There Electrons COMBINE with a PROTON and NADP+. NADP+ is an Organic Molecule that ACCEPTS Electrons during REDOX Reactions. This reaction causes NADP+ to be Reduced to NADPH.
RESTORING PHOTOSYSTEM II – PHOTOLYSIS
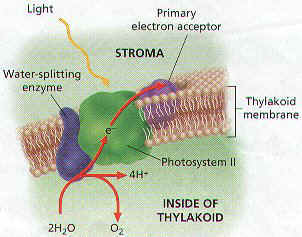 1. The Electrons from Chlorophyll Molecules on Photosystem II REPLACE the Electrons that Leave Chlorophyll Molecules in Photosystem I.
2. If the electrons were NOT Replaced, both Electron Transport Chains would STOP, and Photosynthesis would NOT Occur.
3. The Replacement Electrons are provided by WATER MOLECULES. Enzymes (RuBP carboxylase or Rubisco) inside the Thylakoid SPLITS Water Molecules into PROTONS, ELECTRONS, AND OXYGEN.
2H2O 4H+ + 4e- + O2
4. For Every TWO Molecules of Water that are Split, FOUR Electrons become available to Replace those lost by Chlorophyll Molecules in Photosystem II.
5. The PROTONS that are produced are left inside the Thylakoid, while Oxygen Diffuses out of the Chloroplasts and can Leave The Plant.
6. OXYGEN can be regarded as a Byproduct of the Light Reaction – it is NOT Needed for Photosynthesis.
7. The Oxygen that results from Photosynthesis is ESSENTIAL for Cellular Respiration in most organisms, including Plants.
8. The photochemical splitting of water in the light-dependent reactions of photosynthesis, catalyzed by a specific enzyme is called Photolysis.
9. The enzyme that speeds up this reaction, called RuBP carboxylase (Rubisco), about 20-50% of the protein content in chloroplast, and it may be one of the most abundant proteins in the biosphere.
CHEMIOSMOSIS (KEM-ee-ahz-MOH-suhs)
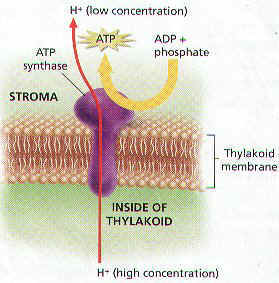 1. An important part of the Light Reaction is the SYNTHESIS of ATP through a process called CHEMIOSMOSIS.
2. Chemiosmosis Relies on a CONCENTRATED GRADIENT of Protons Across the Thylakoid Membrane.
3. Protons are Produced from the Breakdown of Water Molecules, Other Protons are Pumped into the Thylakoid from the Stroma during Photosystem II.
4. Both these mechanisms act to build up a Concentration Gradient of Protons. The Concentration of Protons is HIGHER in the Thylakoid than in the Stroma.
5. The Concentration Gradient Represents Potential Energy. The energy is Harnessed by a Protein called ATP SYNTHASE, which is located in the Thylakoid Membrane.
6. ATP Synthase makes ATP by ADDING a PHOSPHATE GROUP to ADENOSINE DIPHOSPHATE, OR ADP. By Catalyzing the Synthesis of ATP from ADP, ATP Synthase functions as an Enzyme.
7. ATP Synthase Converts Potential Energy of the Protons Concentrated Gradient into Chemical Energy of ATP.
8. Together, NADPH and ATP Provide Energy for the Second Set of Reactions in Photosynthesis.
SECTION 6-2 THE CALVIN CYCLE
The Second Set of reactions in photosynthesis involves a biochemical pathway known as the CALVIN CYCLE. This pathway produces Organic Compounds, using the energy stored in ATP and NADPH during the Light Reactions. The Calvin Cycle is named after Melvin Calvin (1911-1997), the American scientist who worked out the details of the pathway.
OBJECTIVES: Summarized the main events of the Calvin Cycle. Describe what happens to the compounds made in the Calvin Cycle. Distinguish between C3, C4, and CAM Plants. Explain how environmental factors influence photosynthesis.
CARBON FIXATION BY THE CALVIN SYSTEM
1. In the Calvin Cycle, Carbon Atoms From CO2 are Bonded, or “FIXED”, into Organic Compounds.
2. The incorporation of CO2 into Organic Compounds is referred to as CARBON FIXATION.
3. The Calvin Cycle has THREE Major Steps, Which OCCUR within the STROMA of the Chloroplasts. (Figure 6-8)
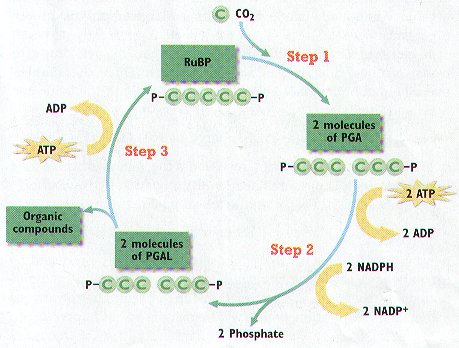
STEP 1 – CO2 Diffuses into the Stroma from the surrounding Cytosol. An Enzyme combines a CO2 Molecule with a FIVE CARBON CARBOHYDRATE CALLED RuBP (ribulose bisphosphate). The PRODUCT is a Six-Carbon Molecule that Splits into a Pair of Three-Carbon Molecules known as PGA (3-phosphoglycerate).
STEP 2 – PGA is Converted into another Three-Carbon Molecule, PGAL, in a Two Part Process:
A. Each PGA Molecule Receives a Phosphate Group from a molecule of ATP – forming ADP
B. The resulting compound then Receives a Proton from NADPH (forming NADP+) and Releases a Phosphate Group, Producing PGAL.
In addition to PGAL, these Reactions produce ADP, NADP+, and Phosphate. These Three Products can be used again in the Light Reactions to Synthesis additional Molecules of ATP and NADPH.
STEP 3 – Most of the PGAL is Converted back into RuBP in a series of reaction to Return to Step 1 and allow the Calvin Cycle to Continue. However, SOME PGAL Molecules LEAVE the Calvin Cycle and can be used by the Plant Cell to Make other Organic Compounds.
THE BALANCE SHEET FOR PHOTOSYNTHESIS
1. Each Turn of the Calvin Cycle Fixes One CO2 Molecule. Since PGAL is a Three-Carbon Compound, it takes Three Turns of the Cycle to Produce each Molecule of PGAL.
2. For Each Turn of the Cycle TWO ATP, and TWO NADPH Molecules are used in Step 2, and ONE ATP Molecule used in Step 3.
3. THREE Turns of the Calvin Cycle uses NINE Molecules of ATP and SIX Molecules of NADPH.
4. The Simplest OVERALL Equation for Photosynthesis, including both Light Reactions and the Calvin Cycle, can be written as:
6CO2 + 6H20 + LIGHT ENERGY C6H12O6 + 6O2
ALTERNATIVE PATHWAYS
1. The Calvin Cycle is the MOST Common Pathway for Carbon Fixation. Plant Species that fix Carbon EXCLUSIVELY through the Calvin Cycle are known as C3 PLANTS.
2. Other Plant Species Fix Carbon through alternative Pathways and then Release it to enter the Calvin Cycle.
3. These alternative pathways are generally found in plants that evolved in HOT, DRY Climates.
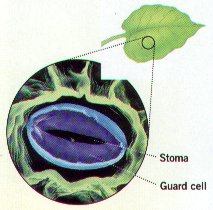 4. Under such conditions, plants can rapidly lose water to the air. Most of the water loss from plants occurs through Small Pores on the Undersurface of the Leaves called STOMATA. Plants obtain carbon dioxide for photosynthesis from the air. Plants must balance their neeed to open their Stomata to receive carbon dioxide and release oxygen with their need to close their Stomata to prevent water loss. A stoma is bordered by TWO Kidney Shaped GUARD CELLS, Guard Cells are modified cells that Regulate Gas and Water Exchange.
5. Stomata are the major passageway through which CO2 Enters and O2 Leaves a Plant.
6. When a plant’s Stomata are partly CLOSED, the level of CO2 FALLS (Used in Calvin Cycle), and the Level of O2 RISES (as Light reactions Split Water Molecules).
7. A LOW CO2 and HIGH O2 Level inhibits Carbon Fixing by the Calvin Cycle. Plants with alternative pathways of Carbon fixing have Evolved ways to deal with this problem.
8. C4 PLANTS – Allows certain plants to fix CO2 into FOUR-Carbon Compounds. During the Hottest part of the day, C4 plants have their Stomata Partially Closed. C4 plants include corn, sugar cane and crabgrass. Such plants Lose only about Half as much Water as C3 plants when producing the same amount of Carbohydrate.
9. THE CAM PATHWAY – Cactus, pineapples have different adaptations to Hot, Dry Climates. They Fix Carbon through a pathway called CAM. Plants that use the CAM Pathway Open their Stomata at NIGHT and Close during the DAY, the opposite of what other plants do. At NIGHT, CAM Plants take in CO2 and fix into Organic Compounds. During the DAY, CO2 is released from these Compounds and enters the Calvin Cycle. Because CAM Plants have their Stomata open at night, they grow very Slowly, But they lose LESS Water than C3 or C4 Plants.
RATE OF PHOTOSYNTHESIS
1. The Rate at which a plant can carry out photosynthesis is affected by the PLANT’S ENVIRONMENT.
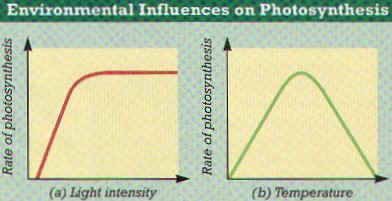
2. THREE THINGS IN THE PLANT’S ENVIRONMENT AFFECT THE RATE OF PHOTOSYNTHESIS: LIGHT INTENSITY, CO2 LEVELS, AND TEMPERATURE. (Figure 6-10)
3. LIGHT INTENSITY – One of the most Important, As Light Intensity INCREASES, the Rate of Photosynthesis Initially INCREASES and then Levels Off to a Plateau.
4. CO2 LEVELS AROUND THE PLANT – Increasing the level of CO2 Stimulates Photosynthesis until the rate reaches a Plateau.
5. TEMPERATURE – RAISING the Temperature ACCELERATES the Chemical Reactions involved in Photosynthesis. The rate of Photosynthesis Increase as Temperature Increases. The rate of Photosynthesis generally PEAKS at a certain Temperature, and Photosynthesis begins to Decrease when the Temperature is further Increased. (Figure 6-10b)