Lab 5 Ap Sample 3


Lab 5   Cell Respiration


Introduction
Cellular respiration is a series of enzyme-mediated reactions that release the energy from carbohydrates.  It begins in the cytosol with glycolysis and is completed within the mitochondria.  Cellular Respiration can be summarized with the following equation:

C6H12O6 + 6O2 → 6CO2 + 6H2O + 686 kilocalories of energy/mole of glucose oxidized

Cellular respiration could be measured in several different ways, but in this experiment oxygen consumption is used.  To do this, it uses a number of the physical laws of gases including the equation, PV = nRT, where P stands for pressure, V for volume, n for the number of molecules, R for the gas constant, and T for temperature.  This law shows the many relationships between these factors and how they affect each other.

This experiment compares respiration rates in germinating and non-germinating peas.  Germination is the growth processes of a seed.  It requires a lot of energy to break the seed coat and as it continues to grow this energy need increases.  Respiration is required to access this energy so as the seed germinates its respiration rates increase.  Non-germinating seeds, however, are dormant and use very little respiration.  Some respiration must occur in order for the seed to live.

Hypothesis
The rate of cellular respiration will be greater in germinating peas than in dry peas, and temperature will have a direct effect on this rate.

Materials
This lab required a room temperature bath and a 10°C bath, ice, a 100-mL graduated cylinder, 50 germinating peas, paper towels, 150 mL of water, dry peas, beads, six vials with attached stoppers and pipettes, absorbent cotton, 5-mL pipette, 15% KOH, non-absorbent cotton, masking tape, and a timer.

Methods
A room temperature bath and a 10°C bath were prepared.  A 100-mL graduated cylinder was filled with 50 mL of water.  Then, 25 germinating peas were added and the amount of displaced water was determined and recorded.  The peas were then removed and placed on a paper towel until needed for Respirometer 1. The graduated cylinder was then refilled with 50 mL of water.  25 dry peas were added and beads were added until the volume equaled that of the germinating peas.  The peas and beads were removed and placed on a paper towel for use in Respirometer 2.           After refilling the graduated cylinder with 50 mL of water, beads were added until the volume again equaled that of the germinating peas.  They were removed and placed in a paper towel for use in Respirometer 3.
The above procedures were repeated to prepare a second set of germinating peas, dry peas and beads, and beads for use in Respirometers 4, 5, and 6.  The respirometers were prepared next by first placing a small wad of absorbent cotton in the bottom of each respirometer and saturating it with 15% KOH, being careful not to get any on the sides of the vial.  Next, a piece of non-absorbent cotton was placed on top of the KOH-soaked cotton.  The first set of germinating peas, peas and beads, and beads were added to Respirometers 1, 2, and 3.  Then the second set was added to Respirometers 4, 5, and 6.
A masking tape sling was created for each of the water baths to hold the respirometers out of the water during equilibration.  Respirometers 1, 2, and 3 were placed in the room-temperature bath, and Respirometers 4,5,and 6 were placed in the 10°C water bath.  The respirometers were allowed to equilibrate for 10 minutes and then were immersed entirely in the water bath. They were checked for leaks and an initial reading was taken.  Then additional readings were taken every 5 minutes for 20 minutes.

Results

Temp

(°C)

Time

(min)

Beads Alone Germinating Peas Dry Peas and Beads
Reading at time X Diff. Reading at time X Diff. Corrected Diff. Reading at time X Diff. Corrected Diff.
10° Initial – 0 14.0 13.5 14.1
0 to 5 14.1 -0.1 13.4 0.1 0.2 14.4 -0.3 -0.2
5 to 10 14.0 0.0 13.2 0.3 0.3 14.5 -0.4 -0.4
10 to 15 14.1 -0.1 12.8 0.7 0.8 14.6 -0.5 -0.4
15 to 20 14.4 -0.4 12.2 1.3 1.7 14.9 -0.8 -0.4
25° Initial – 0 14.8 14.0 15.0
0 to 5 14.8 0.0 13.0 1.0 1.0 14.8 0.2 0.2
5 to 10 14.7 0.1 12.2 1.8 1.7 14.6 0.4 0.3
10 to 15 14.4 0.4 10.3 3.7 3.3 14.4 0.6 0.2
15 to 20 14.3 0.5 9.8 4.2 3.7 14.3 0.7 0.2


Condition
Show Calculations Here Rate in mL O2/minute
Germinating Peas/ 10°C (1.0 – 0.2) / (9 – 5) 0.20
Germinating Peas/ 25°C (2.4 – 1.0) / (7 – 5) 0.70
Dry Peas/ 10°C (0.4 – 0.2) / (26 – 5) 0.01
Dry Peas/ 25°C (-0.4 – -0.2) / (26 – 5) -0.01


Questions:

1.      In this activity, you are investigating both the effect of germination versus non-germination and warm versus cold temperature on respiration rate.  Identify the hypothesis being tested in this activity.

The hypothesis being tested is that respiration in germinating peas occurs at a faster rate than that of non-germinating peas, and that temperature has a direct effect on these rates.

2.      This activity uses a number of controls.  Identify at least three of the controls and describe the purpose of each control.

One control in this experiment is that the dry peas and beads and the beads alone were made to have the same volume as the germinating peas, to make sure that the same amount of air was in each of the vials and displacement would be comparable.  Another control was the respirometer with just beads.  No respiration occurred in this respirometer so it could be used to correct any variances occurring in the surroundings.  The amount of KOH used in each respirometer was controlled so that all the peas had an equal chance to perform cellular respiration.

4.      Describe and explain the relationship between the amount of O2 consumed and time.

The amount of oxygen consumed increased over time as the cell continued cellular respiration.

6.      Why is it necessary to correct the readings from the peas with the readings from the beads?

Uncontrollable aspects of the environment such as barometric pressure could cause a change in the water position without the occurrence of cellular respiration.

7.      Explain the effect of germination (versus non-germinating) on pea seed respiration.

Germination increases the rate of respiration in pea seeds.

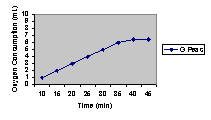
8.      Below is a sample graph of possible data obtained for oxygen consumption by germinating peas up to about 8°C.  Draw in predicted results through 45°C.  Explain your prediction. 


      Oxygen Consumption will increase with temperature until the necessary enzymes become denatured.

9.      What is the purpose of KOH in this experiment?

KOH combines with the CO2 and creates an insoluble precipitant.

10.  Why did the vial have to be completely sealed around the stopper?

The vial had to be sealed so that when the volume of air in the vial decreased it would suction water into the pipette creating an observable change in the water position.

11.  If you used the same experimental design to compare the rates of respiration of a 25g reptile and a 25g mammal, at 10°C, what results would you expect?  Explain your reasoning.

The rate of respiration in the mammal would be greater than that of the reptile because the mammal keeps a constant body temperature while the body temperature of the reptile would be similar to that of its environment.  Lower temperatures decrease the rate of cellular respiration.

12.   If respiration in a small mammal were studied at both room temperature (21°C) and 10°C, what results would you predict?  Explain your reasoning.

Respiration would be greater at 10°C because the animal would need more energy to sustain its normal body temperature.

13.  Explain why water moved into the respirometers’ pipettes.

The volume of air in the vial was reduced when KOH combined with CO2 and water was then pulled in by the suction.

14.  Design an experiment to examine the rates of cellular respiration in peas that have been germinating for 0, 24,48, and 72 hours.  What results would you expect?  Why?

Set up 5 respirometers containing beads, non-germinating peas, peas that have been germinating for 1 day, peas that have been germinating 2 days, and peas that have been germinating 4 days and measure the water displacement over 20 minutes.  The peas that have been germinating the longest will have the highest rate of respiration and the lowest in the non-germinating peas.

Error Analysis:
Several errors could have occurred during this experiment.  Some factors involved could have included inaccurate measurements of the water positions, variations in the water bath temperatures, possible leaks in the respirometers, and mathematical errors.

Discussion and Conclusion
This lab showed that cellular respiration rates are greater in germinating peas than in non-germinating peas.  It also showed that respiration rates increase as temperature increases.  The non-germinating peas showed very little oxygen consumption while the germinating peas had a high rate of oxygen consumption.

BACK


Lab 5 Ap Sample 2 Cell Resp


AP Lab 5  Cell Respiration


Introduction:
Cellular respiration is the release of energy from organic compounds by metabolic chemical oxidation in the mitochondria in each cell. Cellular respiration involves a number of enzyme mediated reactions. The equation for the oxidation glucose is C6H12O6 + O2 à CO2 + H2O + 686 kilocalories per mole of glucose oxidized. There are three ways cellular respiration could be measured. The consumption of O2 (how many moles of O2 are consumed in cellular respiration). Production of CO2 (how many moles of CO2 are produced in cellular respiration?) and the release of energy during cellular respiration. In this lab, the volume of O2 consumed by germinating and non-germinating peas at two different temperatures will be measured.

PV=nRT is the inert gas law. P is the pressure of the gas. V is the volume of the gas. n is the number of molecules of gas. R is the gas constant. T is the temperature of the gas in degrees K. This law tells us several important things about gases. If temperature and pressure are kept constant then the volume of the gas is directly proportional to the number of molecules of the gas. If the temperature and volume remain constant, then the pressure of the gas changes in direct proportion to the number of molecules of gas. If the number of gas molecules and the temperature remain constant, then the pressure is inversely proportional to the volume. IF the temperature changes and the number of gas molecules is kept constant, then either pressure or volume or both will change in direct proportion to the temperature.

In this lab, CO2 , made during cellular respiration will be removed by potassium hydroxide (KOH) and will make potassium carbonate (K2CO3). Carbon dioxide is removed so the change in the volume of gas in the respirometer will be directly proportional to the amount of oxygen that is consumed. In the experiment water will move toward the region of lower pressure. During respiration, oxygen will be consumed and its volume will be reduced to a solid. The result is a decrease in gas volume within the tube, and a related decrease in pressure in the tube. The respirometer with just the glass beads will allow changes in volume due to changes in atmospheric pressure or temperature changes.

Hypothesis:
The respirometer with only germinating peas will have a larger consumption of oxygen and will have a larger amount of CO2 that is converted into K2CO3 than the respirometer with beads and dry peas and the respirometer with beads alone.

Materials:
The materials used in the lab are as follows: a thermometer, 2 water baths, tap water, masking tape, germinating peas, non-germinating (dry) peas, 100 mL graduated n cylinder, 6 vials, 6 rubber stoppers, absorbent and non absorbent cotton, KOH, 5 mL syringe, 6 pipettes, ice, and 6 washers.

Methods:
First, set up both a room temperature 25oC and a 10oC water bath. Make sure you allow time to adjust the temperature in each bath. To obtain a temperature of 10oC add ice to of the baths until the temperature in the bath is 10oC. Next, obtain a 100 mL graduated cylinder and fill it with 50 mL of water. Drop in 25 germinating peas and determine the amount of water that is displaced. Record the volume of the 25 germinating peas. Then remove these peas and place them on a paper towel. They will be used in respirometer 1. Next, refill the graduated cylinder with 50 mL of water and drop 25 non-germinating peas into it. Then drop glass beads into the respirometer until the volume is equivalent to that of the expanded germinating peas. Remove the beads and peas. They will be used in respirometer 2. Next, refill the graduated cylinder with 50 mL of water. Determine how many glass beads would be required to attain a volume that is equivalent to that of the germinating peas. Remove the beads. They will be used in respirometer 3. Then repeat the procedures used above to prepare a second set of germinating peas, dry peas + beads, and beads to be used in respirometers 4,5,and 6.

Assemble the six respirometers by obtaining 6 vials, each with an attached stopper and pipette. Then put a small wad of absorbent cotton in the bottom of each vial and, using the syringe, saturate the cotton with 15 % KOH making sure not to get the KOH on the sides of the respirometer. Then place a small wad of dry cotton on top of the KOH-soaked absorbent cotton. Repeat these steps to make the other five respirometers. Make sure to use about the same amount of cotton in each vial.

Next, place the first set of germinating peas, dry peas + beads and beads in vials 1,2, and 3. Place the second set of germinating peas, dry peas + beads, and beads in vials 4,5, and 6. Insert the stoppers in each vial with the proper pipette. Place a washer on each of the pipettes to be used as a weight.

Make a sling using the masking tape and attach it to each side of the water baths to hold the pipettes out of the water during the equilibration period of 10 minutes. Vials 1,2, and 3, should be in the bath containing water of 25o C. Vials 4, 5, and 6 should be in the bath containing water that is 10oC. After the equilibration period completely immerse all six respirometers in the water completely. Water will enter the pipette for a short distance and stop. If it does not stop, there is a leak. Make sure the pipettes are facing so you can read them. The vials should not be shifted during the experiment and your hands should not be placed in the water during the experiment.

Allow the respirometers to equilibrate for three more minutes and then record the initial water in each pipette time 0. Check the temperature in both baths and record in table 5.1. Every five minutes for 20 minutes, take readings of the water’s position in each pipette, and record the data in table 5.1.

Results:

Table 5.1: the Measurement of Oxygen Consumption by Soaked and Dry Pea Seeds at Room Temperature 25o C and 10oC Using Volumetric methods.

Temp o C Time (min) Reading at time X Diff. Reading at time X Diff. Corrected Diff. Reading at time X Diff. Corrected Diff.
25 Initial- 0 14.4 13.9 14.2
25 0 to 5 14.1 .3 13 .9 .6 14.1 .1 -.2
25 5 to 10 14.0 .4 11.1 2.8 2.4 13.9 .3 -.1
25 10 to 15 13.9 .5 10.3 3.6 3.1 13.7 .5 0
24 15 to 20 13.9 .5 8.8 5.1 4.6 13.5 .7 .2
10 Initial – 0 14.2 14.2 14.7
10 0 to 5 14.8 -.6 14.0 .2 .8 15.2 -.5 .1
10 5 to 10 14.6 -.4 13.5 .7 1.1 15 -.7 -.3
10 10 to 15 14.8 -.6 13.2 .9 1.5 15 -.7 -.1
10 15 to 20 14.9 -.7 12.6 1.6 2.3 15 -.7 0

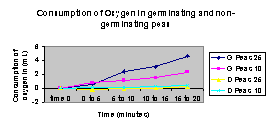
Graph: Consumption of Oxygen for Germinating Peas and Dry Peas at 10oC and 25o C.
Questions:

            1. In this activity, you are investigating both the effect of germination versus non-germination and warm temperature versus cold temperature on respiration rate. Identify the hypothesis being tested in this activity.
The hypothesis being tested in this activity is that the germinating peas in a water bath of 25 o C will have a higher respiration rate than the other vials.

2. This activity uses a number of controls. Identify at least three of the controls, and describe the purpose of each control.

One control is each vial had the same volume. This showed that the volume of the vial did not effect respiration rate. Another control was the vial with beads alone. The beads carried out no respiration. The final control was the 10 minute equilibration period. This allowed the contents of the vials to carry out respiration for a short period of time before they were completely immersed in the water.

  3.Graph the results from the corrected difference column for the germinating and dry peas at both room temperature and at 10oC.
4. Explain the relationship between the amount of oxygen consumed and time.

As time increased oxygen consumption increased.

5. From the slope of the four lines on the graph, determine the rate of oxygen consumption of germinating and dry peas during the experiments at room temperature and at 10o C.

Condition Show Calculations Rate in mL O / minute
Germinating peas at 10oC 2.3-1.5=.8/5 .16mL O2  /minute
Germinating peas at room temperature 4.6-3.1/5 .3mL O2  /minute
Dry peas at 10oC (.1)/5= .02 mL  O2  /minute
Dry peas at room temperature (.2-0 )/5= .04 mL O 2 /minute

    6. Why is it necessary to correct the readings from the peas with the readings from the beads?

The beads carried out no cellular respiration. The peas did. Changes in atmospheric pressure could have caused changes in respiration rate and correcting the readings provided the most accurate results under the given conditions.

7. Explain the effect of germination versus non-germination on pea seed respiration.

Germination causes a higher rate of respiration than the non-germinating peas.

8. Graph the predicted results through 45o C. Explain your prediction.

As the temperature increased cellular respiration increased, but after a certain temperature the respiration rate will start to go down. The peak is the optimal temperature.

9. What is the purpose of KOH in this experiment?

KOH removes carbon dioxide formed during cellular respiration.

10. Why did the vial have to be completely sealed around the stopper.

The stopper was completely sealed to prevent water from entering the respirometer.

11. If you used the same experimental design to compare the rates of respiration of a 25g. reptile and a 25 g. mammal at 10oC what results would you expect? Explain your reasoning.

The mammal would carry out a higher rate of cellular respiration. This is because the mammal maintains a constant temperature that is higher than the temperature of the cold blooded reptiles that will have a temperature of 10 C.

12. If respiration in a small mammal were studied at both room temperature 21 o C and 10oC what results would you predict? Explain your reasoning.

The rate of cellular respiration would be higher at 21 degrees C because the 10 degrees C temperature could cause the overall body of the mammal temperature to drop the most.

13. Explain why water moved into the respirometers’ pipettes.

Water moved into the pipettes because oxygen was being consumed and allowed water to move only partially into the pipette.

14. Design an experiment to examine the rates of cellular respiration in peas that have been germinating for 0, 24, 48, and 72 hours. What results would you expect? Why?

I would use the same format using respirometers to measure the cellular respiration rate of the peas. The peas that had been germinating for 72 hours would have a higher respiration rate because they have a higher energy demand.

Error Analysis:
Several factors could have caused inaccurate results in this experiment. First, not maintaining a constant temperature in the water bath could have caused inaccurate results. Also moving the vials in the water after the experiment began could have caused inaccurate results. Putting your hands in the water bath while the vials were in the water could have caused inaccurate results. Allowing the peas to come into contact with the KOH could have also caused inaccurate results. Finally not having the same amount of cotton in each vial could have caused an error in the results.

Conclusion:
In this experiment the vial with just germinating peas had the greatest consumption of oxygen. This is because germinating peas carried out a more rapid process of cellular respiration than the non-germinating peas. The beads carried out no cellular respiration. The non-germinating peas require less energy than the germinating peas so the dry peas carry out a slower process of cellular respiration. This in turn caused less oxygen to be consumed in the vials with non-germinating peas than the vials with germinating peas. The higher temperature caused cellular respiration to occur at a higher rate which in turn caused a greater consumption of oxygen.

BACK


Lab 5 Ap Sample 4


Cellular Respiration
AP Biology Lab 5


Introduction:
Cellular respiration is the release of energy from organic compounds by metabolic chemical oxidation in the mitochondria within a cell. There are a number of physical laws that relate to gases and are important in the understanding of how the equipment in this lab works. These are summarized as general gas laws that state: PV=nRT where: P stands for pressure of the gas, V stands for the volume of the gas, n stands for the number of molecules of gas there are, R stands for the gas constant, and T stands for the temperature of the gas. A respirometer is the system used to measure cellular respiration. Pressure changes in the respirometer are directly relative to a change in the amount of gas there is in the respirometer as long as the volume and the temperature of the respirometer do not change. To judge the consumption of oxygen in two different respirometers you must reach equilibrium in both respirometers.

Cellular respiration is the procedure of changing the chemical energy of organic molecules into a type that can be used by organisms. Glucose may be oxidized completely if an adequate amount of oxygen is present. The equation for cellular respiration is C6H12O6 + 6O2 à 6CO2 + 6H2O + energy. Carbon dioxide is formed as oxygen is used. The pressure due to CO2 might cancel out any changes due to the consumption of oxygen. To get rid of this problem, a chemical will be added that will selectively take out the carbon dioxide put off. Potassium hydroxide will chemically react with the carbon dioxide by this equation: CO2 + K2CO3 + H2O.


Hypothesis:
The rate of cellular respiration will be higher in germinating peas in cold and room temperature water baths than in that of the beads or non-germinating peas. The cooler temperature in the cold water baths should slow the process of cellular respiration in the peas.


Materials:
The materials used in this lab were the following: a water bath, a graduated cylinder, a thermometer, tape, metal washers, beads, germinating peas, non-germinating peas, beads, beakers, another graduated cylinder, ice, paper, and a pencil are needed for this lab.


Methods:
Obtain a room temperature water bath and a 10-degree Celsius water bath. Add ice to room temperature water and watch the thermometer until the temperature has reached 10-degrees Celsius. For respirometer one, obtain a graduated cylinder and fill it with 50mL of water. Drop in 25 germinating peas and determine the water displacement. Record the volume, remove the peas and place them on a paper towel. For respirometer two, obtain the same graduated cylinder, filled again with 50mL of water. Drop twenty-five of the non-germinating peas in the water and continue adding beads to the water until the same water displacement for the non-germinating peas equals the first result. Remove the contents, and drain the water leaving the peas and beads to dry on a paper towel. For respirometer three, fill the 100mL graduated cylinder with 50mL of water and obtain the first water displacement value by adding just beads to the water in the cylinder. Take out the beads, allow the water to drain, and repeat this same procedure for respirometers 4, 5, and 6, which will be placed in the cooler water. For assembly of the respirometers, obtain 6 vials, each with a stopper and a pipette. Place a small wad of absorbent cotton in the bottom of each vial and using a dropper, saturate the cotton with 15% KOH solution. Make sure the vials are dry on the inside. Do not get KOH on the sides of the respirometer. Place a small wad of non-absorbent cotton on top of the KOH saturated cotton, making sure the same amount is used for each respirometer. Place the first set of peas in their respective vials. Do the same for the second set of peas. Insert the stopper with the calibrated pipette. Place a weighted collar on the end of each vial. Make a sling of masking tape attached to each side of the water baths to hold the pipettes out of the water during the equilibration period of seven minutes. Vials 1, 2, and 3, should rest in the room temperature water while 4, 5, and 6, should rest in the 10-degree Celsius water bath. After seven minutes of equilibration, immerse all 6 respirometers entirely in their designated water baths. Water enters the pipette for a short distance and stops. If the water continues to move into a pipette, check for leaks. Working quickly, arrange the pipettes so the can be read through the water at the beginning of the experiment. These should not be shifted during the experiment. Keep hands out of the water bath after the experiment has started. Make sure a constant temperature is maintained. Allow respirometers to equilibrate three more minutes, record the initial position of the water in each pipette to the nearest .01mL. Check the temperature in both water baths and record in table 5.1. Check and record every five minutes for twenty minutes by repeating the procedure for that task.

Data:


Table 5.1

Beads Alone Germinating Peas Dry peas and Beads
Read-ing @ time X Diff. Reading @ time X Diff. Corrected Diff. Reading @ time X Diff. Corrected Diff.
Initial-0 14.0 ——- 13.5 ——- —– 14.1 —- —-
0-5 14.1 -0.1 13.4 0.1 0.2 14.4 -.3 -.2
5-10 14.0 0 13.2 0.3 0.3 14.5 -.4 -.4
10-15 14.1 -0.1 12.8 0.7 0.8 14.6 -.5 -.4
15-20 14.4 -0.4 12.2 1.3 1.7 14.9 -.8 -.4
Initial-0 14.8 ——- 14.0 ——- —– 15 —- —-
0-5 14.8 0 13.0 1.0 1.0 14.8 .2 .2
5-10 14.7 0.1 12.2 1.8 1.7 14.6 .4 .3
10-15 14.4 0.4 10.3 3.7 3.3 14.4 .6 .2
15-20 14.3 0.5 9.8 4.2 3.7 14.3 .7 .2

Graph 5.1

Table 5.2


Condition Show Calculations Here Rate in mL water/minutes
Germinating peas/ 10degrees Celsius Sloped downward steadily, bigger drop off at the end Rise=1.3

Rate=0.052

Germinating peas/ room temperature Steady drop downward. Rise=4.2

Rate=0.168

Non-germinating peas/ 10degrees Celsius Steadily gained height. Fall=1.5

Rate=0.06

Non-germinating peas/ room temperature Steady fall in rate. Fall=0.7

Rate=0.028


Graph 5.2

Questions:
In this activity, you are investigating both the effects of germination versus non-germination and warm temperature versus cold temperature on respiration rate. Identify the hypothesis being tested on this activity.
The hypothesis of this experiment was: The rate of cellular respiration will be higher in germinating peas in cold and room temperature water baths than in that of the beads or non-germinating peas. The cooler temperature in the cold water baths should slow the process of cellular respiration in the peas.


This activity uses a number of controls. Identify at least three of the controls, and describe the purpose of each. First of all, the water baths held a constant temperature. Secondly, the volume of KOH was constant from vial to vial. Lastly, the equilibration period was identical for all the respirometers.


Describe and explain the relationship between the amount of oxygen consumed and time. The amount of oxygen that was consumed was the greatest in the warmer water. The oxygen consumption increased over time in the germinating peas.


Why is it necessary to correct the readings from the peas with the readings from the beads? This is necessary to show the actual rate at which cellular respiration occurs in peas. The beads served as a control variable.


Explain the effects of germination versus non-germination on peas seed respiration. The germinating seeds are alive and growing, therefore respirate to grow.


Explain the results shown in the sample graph in your lab manual. As the temperature increased, the enzymes denatured so germination was inhibited.


What is the purpose of KOH in this experiment? The KOH drops absorbed the carbon dioxide so that it would not cause the put off of that gas to make the readings equilibrate.


Why did the vial have to be completely sealed under the stopper? The stopper at the top of the vial had to be completely sealed so that no gas could leak out of the vial and no water would be allowed into the vial.


If you used the same experimental design to compare the rates of respiration of a 35g mammal at 100 degrees Celsius, what results would you expect? Explain your reasoning. Respiration would be higher in the mammal since they are warm-blooded.


If respiration in a small mammal were studied at both room temperature, 21-degrees Celsius and 10-degrees Celsius, what results would you predict? Explain your reasoning. Respiration would be higher at 21 degrees because the animal would have to keep its body temperature up. The results would multiply at 10-degrees because the mammal would have to keep its body that much warmer in comparison to the room temperature.


Explain why water moved into the respirometer pipettes. While the peas underwent cellular respiration, they consumed oxygen and released carbon dioxide which reacted with the KOH in the vial, resulting in a decrease of gas in the pipette. The water moved into the pipette because the vial and pipette were completely submerged into the bath.


Design an experiment to examine the rates of cellular respiration in peas that have been germinating for 0, 24, 48, and 72, hours. What results would you expect? Why? A person could set up four respirometers which have one of the following: Seeds that have not begun to germinate, seeds germinating for one day, seeds germinating for two days and seeds germinating for three days. The results would probably be that there would be no oxygen used by the seeds that have not germinated yet. The seeds that have been germinating for three days will have the greatest amount of oxygen consumption.

Error Analysis:
Error in this lab could have occurred if the seals on the vials weren’t tight and there was a leak of water into the vials. Another source of error could have been if the KOH had touched the sides of the vial. Also, the absorbent cotton balls that were used for the KOH could have been too saturated. Another source of error could be at the temperature of the water baths. If a close eye wasn’t kept on the temperature, the ten degree Celsius would have fallen in degrees.

Conclusion:
Oxygen consumption in respirometers with germinating peas is greater than in the respirometers with non-germinating peas. Respiration was affected by the temperature of the water bath as well. Respiration occurs faster in the warmer water baths.

BACK


Lab 4 Plant Pigments

Lab 4 Plant Pigments & Photosynthesis

Introduction:
The purpose of this lab experiment was to separate plant pigments using paper chromatography, and to measure the rate of photosynthesis in isolated chloroplasts. Because of capillary action the solvent moves up the paper causing the pigments to become visible at certain distances.

The substances visible on the paper are called pigments. Chlorophyll a is the main pigment that makes up about 75% of the pigmentation in plants. Chlorophyll b makes up about 25% of the pigmentation. And carotenes and xanthophylls are accessory pigments that make up the rest of the pigmentation. Carotene is the most soluble of the pigments and as a result will be carried the farthest by the solvent. The paper will display a spectrum of the pigments found in the spinach leaves. Using the formula Rf one can determine the relationship between the distance the solvent traveled to the distance the pigment traveled.


Rf=distance l2igment migrated (mm) distance solvent front migrated

Light is a part of a continuum of radiation or energy waves. The energy from visible light is used in the photosynthetic process. Light is absorbed in the leaf pigments, electrons within each photosystem are boosted to a higher energy level to produce ATP and to reduce NADP and NADPH. The ATP is then used in carbon fixation. This is the incorporation of CO2 into organic molecules.
To measure light transmittance in chloroplasts a spectrophotometer will be used. The reason behind measuring the light transmittance is to calculate the rate of photosynthesis in the chloroplasts. A solution called DPIP will be used in place of NADP to judge the color change of the chloroplast solutions. This technique is known as dye- reduction and it tests the hypothesis that light and chloroplasts are required for light reactions to occur.

Hypothesis:
In this experiment it is hypothesized that the cuvette with boiled chloroplasts and the cuvette kept in the dark containing unboiled chloroplasts will have very slight changes in light transmittance, whereas the cuvette containing unboiled chloroplasts that have been exposed to light will have an increasingly higher % transmittance over the course of time.

Materials and Methods:
Lab 4A:
The materials used in this section of the lab were: filter paper, glass vial, small amount of solvent, a quarter, and spinach leaves. The first step was to cut a point on one end of the filter paper and draw a pencil line 1.5cm from the tip of this point. Next a spinach leave was placed on the strip of paper and rolled over with a quarter on top of the pencil line. This gives a green line across the paper, which contains the pigments of the leave. Then the strip of paper was placed into the vial with the point down in the bottom. When the pigment reached the point 1 cm from the top of the vial then it was removed. The solvent front was then quickly marked with a pencil and then each pigment front was marked as well. From the distance the pigment traveled and the distance the solvent traveled the Rf value was calculated.

Lab 4B:
The materials used in this lab were: a spectrophotometer, 4 cuvettes, phosphate buffer, distilled water, boiled chloroplasts, unboiled chloroplasts, and DPIP .First the cuvettes were labeled 1-4 and cleaned with lens paper because even the oil from your hands can affect the transmittance of light through the cuvette. Cuvette 2 was then wrapped with foil to keep the contents in the dark. Next 1 ml of phosphate buffer was added to all four cuvettes, 4ml of distilled water was added to cuvette 1, 3rn1 of distilled water was added to cuvettes 2,3, and 4, and Iml of DPIP was added to cuvettes 2,3, and 4. Then 3 drops of unboiled chloroplasts were added to cuvette 1, it was covered with parafilm, placed into the spectrophotometer, and set to 100% transmittance. This cuvette was used to recalibrate between readings as well. Three drops of unboiled chloroplasts were placed in cuvette 2 and 3, and three drops of boiled chloroplasts were placed in cuvette 4. The cuvettes were then covered with parafilm. Each was placed in the spectrophotometer and the % transmittance of each, every five minutes for 15 minutes, was recorded.

Data:
Table 4.1

Questions:

1. Which pigment migrated the furthest and why? Carotene, it was the most soluble and didn’t form bonds with the filter paper.
2. Which of the 2 types of chlorophyll is more soluble? Chlorophyll a
3. Why do leaves change color in autumn? The chlorophyll production in the leaves slows down.
4. What is the function of the chlorophyll in photosynthesis? They absorb red and blue light rays.
5 .What are the accessory pigments and what are their functions? Carotene and xanthophylls both absorb different wavelengths of light than chlorophyll does.
6. What are some other ways chromatography is used to separate plant pigments? There are three types: Column, Paper, and Thin Layer chromatography.
7 .What does the & value represent? The distance the pigment traveled and the distance the solvent traveled expressed as one value.
8. What factors involved in the separation of the pigments? In this test it was solubility.
9 .Would you expect the Rf value of a pigment to be same if a different solvent were used? Explain. No, for a different solute there would be a different solvent rate.
10. What kind of chlorophyll does the reaction center contain? What are the roles of the other pigments? Chlorophyll a” the other pigments catch different wavelengths of light.

Error Analysis:

Fingerprints on either the filter paper or the cuvettes may have affected the experiment because the oil from your hands can get on these things and affect the results. The spectrophotometer may have not been calibrated correctly because this was the first time this particular one had been used. Other than these there were few places for error in this lab.

Conclusion:

From lab 4a we discovered that the many pigments found in chloroplasts are all involved in gathering energy from sunlight. The spectrum of color displayed on the filter paper showed the pigments and the solubility of each. In lab 4b the spectrophotometer measured the light transmittance through the various cuvettes and the chloroplast solutions in each. The actual purpose of this was to observe the DPIP go from a blue color to a clear color. This indicated that photosynthesis was occurring and at what rate it was occurring. The cuvette with the unboiled chloroplasts that had been exposed to light showed the biggest change in % transmittance, which indicates that the amount of light available has a very big effect on the rate at which the light reactions of photosynthesis occur .


BACK

Lab & AP Sample 2


Plant Pigments and Photosynthesis

Introduction:
Photosynthesis has two main parts, which are the light dependent and the light –independent. In the light-dependent reactions pigments trap energy from light, and this energy is used to split water molecules (photolysis). The light-independent reactions or dark phase of photosynthesis involve the fixing of carbon dioxide. It makes glucose and fructose chains and also releases oxygen , which passes through the stomata of the plant.

Organisms that carry out photosynthesis making their own organic molecules are called autotrophic. Some autotrophic organisms include plants, algae, and blue-green bacteria. Plants have many varieties of pigments, all of which absorb different colors of light. Chlorophyll a is the primary plant pigment and makes up about three-fourths of all the plant pigments. It absorbs red and blue light and is not found in photosynthetic bacteria.

Chlorophyll b is another plant pigment. It absorbs blue-green and orange-red light. Carotenoids are a type of accessory pigment that absorb blue and blue-green light. These pigments are fat soluble and usually masked by chlorophyll a. Anthocyanin is another accessory pigment that absorbs bright red colors. There is also chlorophyll c and d that sometimes take the place of chlorophyll b.

Chromatography is a process used to separate mixtures that can separate plant pigments. This lab uses paper chromatography where a piece of paper is used to wick solvent up to the pigments and separate them according to solubilities. The rate of migration on a chromatogram is the Rf value.


Hypothesis


Plants contain several different pigments, and the rate of photosynthesis in plant cells is directly related to light and temperature.


Materials


Exercise 4A: Plant Pigment Chromatography

This exercise required 1 50-mL graduated cylinder, a small amount of a solvent, a stopper, filter paper, scissors, a pencil, spinach leaves, and a quarter.

Exercise 4B: Photosynthesis/The Light Reaction

The materials needed for this part of the lab were a spectrophotometer, a light, a water flask, a test tube rack, ice, 5 labeled cuvettes, lens tissue, foil, and parafilm. The substances put in the cuvettes were 5 mL of phosphate buffer, approximately 16 mL of distilled water, 9 drops of unboiled chloroplasts, and 3 drops of boiled chloroplasts.


Methods


Exercise 4A: Plant Pigment Chromatography

A 50-mL graduated cylinder was filled with about 1 cm of solvent and then tightly stoppered. The filter paper was then cut to a point on one end, and a line was drawn 1.5 cm above the point. Using the ribbed edge of a quarter, spinach cells were extracted onto the pencil line. This procedure was repeated 8-10 times using a new portion of the leaf each time. The filter paper was then placed in the cylinder with the tip barely touching the solvent and none of the edges touching the sides. When the solvent reached 1 cm below the top of the paper, it was removed from the cylinder. The solvent location was immediately marked, and then the bottom of each pigment band was also marked.

Exercise 4B: Photosynthesis/The Light Reaction

The spectrophotometer was set to 605 nm and allowed to warm up. The chloroplast suspensions were prepared the previous day, part of which were boiled, and stored on ice until they were ready for use. An incubation area was prepared with a flood light, water flask, and test tube rack, by using the flask as a heat sink between the light and the rack. Five cuvettes were numbered respectively and then wiped with lens tissue. The walls and bottom of cuvette 2 were covered with foil and a foil cap was made for the top.

To each cuvette 1 mL of phosphate buffer was added. Then, to cuvette 1 4 mL of distilled water was added, but to cuvettes 2, 3, and 4 3 mL of distilled water was added. Next, 1 mL of DPIP was added to cuvettes 2, 3,and 4. To cuvette 5, 3 mL plus 3 drops of distilled water were added and 1 mL of DPIP. To cuvette 1, 3 drops of unboiled chloroplasts were added.

The spectrophotometer was brought back to zero and the contents of cuvette 1 were mixed by inverting and placed in the sample holder. Cuvette 1 was used periodically through this experiment to recalibrate the spectrophotometer. Three drops of unboiled chloroplasts were added to cuvette 2. After removing the foil sleeve, it was placed in the sample holder and the transmittance was recorded. Additional readings were also taken at 5, 10, and 15 minutes. Next, three drops of unboiled chloroplasts were transferred to cuvette 3. The percent transmittance was recorded at 0, 5, 10, and 15 minutes. Three drops of boiled chloroplasts were added to cuvette 4, and the transmittances were recorded at the same times. Finally, cuvette 5 was mixed and placed in the sample holder. The transmittance readings were recorded.


Results

Table 4.1 Distance Moved by Pigment Band


Band Number


Distance (mm)


Band Color

1. 0 mm Yellow-brown
2. 5 mm Light green
3. 30 mm Green
4. 48 mm Yellow


Distance Solvent Front Moved 60 mm.

Table 4.2 Rf Values


0.8 = Rf for xanthophyll (yellow)

0.5 = Rf for chlorophyll a (bright green to blue green)

0 = Rf for chlorophyll b (yellow green to olive green)


Table 4.4 Transmittance (%)


Cuvette


0


5


10


15


2 Unboiled/Dark

41% 43% 44% 43%
 

3 Unboiled/Light

35% 38% 39% 37%
 

4 Boiled/Light

51% 52% 53% 54%
 

5 No Chloroplasts

57% 57% 56% 55%


Lab 4B Color Chart


Cuvette


Initial Color


Final Color


1

Clear Clear
 

2

Light clear blue Blue/green
 

3

Light clear blue Dark clear blue
 

4

Light clear blue Light clear blue
 

5

Light clear blue Dark clear blue


Questions:
Exercise 4A: Plant Pigment Chromatography


What factors are involved in the separation of the pigments?


The solubility, size of particles, and their attractiveness to the paper are all involved in the separation.


Would you expect the Rf value of the pigment to be the same if a different solvent were used? Explain.


No, the different solubilities of the pigments would change the Rf values. For example chlorophyll b is only soluble to fat solutions.


What type of chlorophyll does the reaction center contain? What are the roles of the other pigments?


The reaction center contains chlorophyll a. The other pigments collect different light waves and transfer the energy to chlorophyll a.


Exercise 4B: Photosynthesis/The Light Reaction


What is the purpose of DPIP in this experiment?


DPIP is the electron acceptor in this experiment.


What molecule found in chloroplasts does DPIP “replace” in this experiment?


DPIP substitutes for the NADP molecules.


What is the source of the electrons that will reduce DPIP?


The electrons come from the photolysis of water.


What was measured with the spectrophotometer in this experiment?


The spectrophotometer measures the percentage of light transmittance through the cuvette due to DPIP reduction.


What is the effect of darkness on the reduction of DPIP? Explain.


The effect of darkness is that no reaction will occur.


What is the effect of boiling the chloroplasts on the subsequent reduction of DPIP? Explain.


Boiling denatures the protein molecules and stops the reduction.


What reasons can you give for the difference in the percent transmittance between the live chloroplasts that were incubated in the light and those that were kept in the dark?


In the dark cuvette, there was no light energy available, so there was no flow of electrons and no photolysis of water, while in the lighted cuvette these processes were allowed to continue.


Error Analysis
In Lab 4A, several mistakes could have been made with the chromatography paper. Too much handling, bending, or allowing the paper to touch the sides of the cylinder could all have affected the outcome of this experiment. The different pigment bands were also difficult to distinguish.

In Lab 4B, the procedure was very complicated and required a lot of pre-lab planning and reading. Incorrect usage of the spectrophotometer or neglecting to recalibrate often enough could have caused errors in this portion of the lab.


Discussion and Conclusion

Lab 4A demonstrated the different plant pigments by chromatography and showed how to calculate Rf values and explained their importance. There are 4-5 main pigments present in plants ranging from green to yellow in color. Lab 4B proves that light and chloroplasts are required for the light reactions of photosynthesis to occur. It showed the effects of boiling, denaturing, which did not allow photosynthesis to occur.

BACK