
Author: Biology Junction Team
What Am I Doing Here?
Identify the Controls and Variables
The Simpson’s Identifying Controls and Variables
 Smithers thinks that a special juice will increase the productivity of workers. He creates two groups of 50 workers each and assigns each group the same task (in this case, they’re supposed to staple a set of papers). Group A is given the special juice to drink while they work. Group B is not given the special juice. After an hour, Smithers counts how many stacks of papers each group has made. Group A made 1,587 stacks, Group B made 2,113 stacks. Smithers thinks that a special juice will increase the productivity of workers. He creates two groups of 50 workers each and assigns each group the same task (in this case, they’re supposed to staple a set of papers). Group A is given the special juice to drink while they work. Group B is not given the special juice. After an hour, Smithers counts how many stacks of papers each group has made. Group A made 1,587 stacks, Group B made 2,113 stacks.
|
Identify the:
1. Control Group 2. Independent Variable 3. Dependent Variable 4. What should Smithers’ conclusion be?
5. How could this experiment be improved? |
 Homer notices that his shower is covered in a strange green slime. His friend Barney tells him that coconut juice will get rid of the green slime. Homer decides to check this this out by spraying half of the shower with coconut juice. He sprays the other half of the shower with water. After 3 days of “treatment” there is no change in the appearance of the green slime on either side of the shower. Homer notices that his shower is covered in a strange green slime. His friend Barney tells him that coconut juice will get rid of the green slime. Homer decides to check this this out by spraying half of the shower with coconut juice. He sprays the other half of the shower with water. After 3 days of “treatment” there is no change in the appearance of the green slime on either side of the shower.
|
6. What was the initial observation?
Identify the- 8. Independent Variable 9. Dependent Variable 10. What should Homer’s conclusion be?
|
Bart believes that mice exposed to microwaves will become extra strong (maybe  he’s been reading too much Radioactive Man). He decides to perform this experiment by placing 10 mice in a microwave for 10 seconds. He compared these 10 mice to another 10 mice that had not been exposed. His test consisted of a heavy block of wood that blocked the mouse food. he found that 8 out of 10 of the microwaved mice were able to push the block away. 7 out of 10 of the non-microwaved mice were able to do the same. he’s been reading too much Radioactive Man). He decides to perform this experiment by placing 10 mice in a microwave for 10 seconds. He compared these 10 mice to another 10 mice that had not been exposed. His test consisted of a heavy block of wood that blocked the mouse food. he found that 8 out of 10 of the microwaved mice were able to push the block away. 7 out of 10 of the non-microwaved mice were able to do the same. |
Identify the: 11. Control Group 12. Independent Variable 13. Dependent Variable 14. What should Bart’s conclusion be? 15. How could Bart’s experiment be improved? |
 Krusty was told that a certain itching powder was the newest best thing on the market, it even claims to cause 50% longer lasting itches. Interested in this product, he buys the itching powder and compares it to his usual product. One test subject (A) is sprinkled with the original itching powder, and another test subject (B) was sprinkled with the Experimental itching powder. Subject A reported having itches for 30 minutes. Subject B reported to have itches for 45 minutes. Krusty was told that a certain itching powder was the newest best thing on the market, it even claims to cause 50% longer lasting itches. Interested in this product, he buys the itching powder and compares it to his usual product. One test subject (A) is sprinkled with the original itching powder, and another test subject (B) was sprinkled with the Experimental itching powder. Subject A reported having itches for 30 minutes. Subject B reported to have itches for 45 minutes. |
Identify the: 16. Control Group 17. Independent Variable 18. Dependent Variable 19. Explain whether the data supports the advertisements claims about its product. |

Lisa is working on a science project. Her task is to answer the question: “Does Rogooti (which is a commercial hair product) affect the speed of hair growth”. Her family is willing to volunteer for the experiment. |
20. Describe how Lisa would perform this experiment. Identify the control group, and the independent and dependent variables in your description. |
Chapter 1 Quiz
| Introduction to Biology |  |
| 1. Science assumes that natural laws (such as the law of gravity): apply uniformly through space and time change with time apply in a lab, but not nature differ according to location2. A toad burrows into the mud to stay cool in the summer, this is an example of a living organism’s ability to: reproduce maintain homeostasis have metabolism be organized3. The smallest unit of life is the: atom organelle molecule cell 4. An organism found in the fish tank was green, unicellular and autotrophic – it would most likely be classified as a(n): 5. Evolution occurs through the process of: 6. The tissues of the body are organized into: 7. Organisms that do not have a membrane bound nucleus are called: 8. Creationism is not considered a theory because it violates which scientific principle: 9. All living things must: 10. A scientist is studying whether cows will produce more milk when given an experimental drug. He gives 100 female cows the drug and then tests their milk production. Which of the following would be a good control group?
Score =
|
|
Concept Map – Characteristics of Life
Constructing a Concept Map of the Characteristics of Life
| Objective: Students will work in groups to construct a concept map of the characteristics of life that demonstrates their knowledge of the attributes and criteria used by biologists to measure life. |
- Brainstorming Phase: Identify facts, terms, and ideas that you think are in anyway associated with the topic. Make a list of these items and print them neatly on small Post-It® notes, one per note, in very brief form, i. e. a single word or short phrase. This is a brain-storming process, so write down everything that anybody in your group thinks is important and avoid discussing how important the item is. Don’t worry about redundancy, relative importance, or relationships at this point. Your objective here is to generate the largest possible list you can. Before your group completes this step, you may have more than 50 items.
- Organizing Phase: Spread out your concepts (Post-It® notes) on a flat surface so that all can be read easily and, together, create groups and sub-groups of related items. Place your CENTRAL THEME in the middle of the terms. For this project, the theme of the map is “LIFE CHARACTERISTICS“. Try to group items to emphasize relationships. Feel free to rearrange items and introduce new items that you omitted initially. Note that some concepts will fall into multiple groupings.
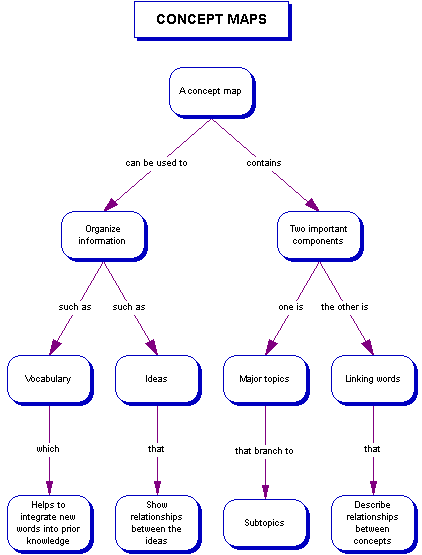
- Linking Phase: Use lines with arrows to connect and show the relationship between connected items. Write a word or short phrase by each arrow to specify the relationship. Many arrows can originate or terminate on particularly important concepts. Arrows should only go one way, and each arrow should have a linking phrase attached to it.
Example of a Concept Map
Grading
| Rarely (1) | Sometimes (2) | Frequently (3) | Extensively (4) | |
| Overall | The concept map does not seem to have a focus. | The purpose of the concept map is not clear. Few characteristics of life are represented. | The concept map has a focus, though it is somewhat disjointed or difficult to decipher. Most characteristics of life are represented. | The concept map clearly has a focus and a purpose. A casual viewer would understand what the map is trying to convey. All characteristics of life are represented. |
| Terms | Very few relevant terms present | Not enough terms are used to show clear relationships and purpose or many terms are irrelevant | Extensive use of terms, a few obvious points missing, or irrelevant terms present | An extensive use of terms and vocabulary used in the map. Terms are relevant. |
| Links | Many links not clear and unlabeled. Failure to show relationships. | Some links not clear or unlabeled. Relationships between ideas poorly established. | Links show the relationships between concepts. A few terms have more than one link present. | Links clearly show the relationships between concepts. Most of the concepts have more than one link present |
| Technical | Very poor organization, map impossible to follow. | Map somewhat difficult to follow. Organization poor. | Map easy to read and to follow. Organization fair. | Map easy to read and to follow. Organization good. No grammar or spelling errors. |