Category: 1st Semester
01_13bPositiveFeedback_A
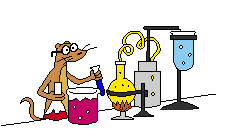
Volume of Irregular Object Lab
| Volume of an Irregular-shaped Object | |||||||||||||||||||||||||||||||||
| Introduction The word mass is used to tell how much matter there is in something. Matter is anything you can touch physically. An electronic scale or triple beam balance can be used to tell the mass of an object. Volume is a measure of how much space an object occupies. When measuring the volume of a liquid, a graduated cylinder can be used. Measurement is the collection of quantitative data (numbers). Measurements are not only numbers. They must always contain a unit of measurement. In the Metric System, the gram (g) is the basic unit of measurement for mass. The basic unit of measurement for the volume of liquids is the milliliter (ml). The density of an object can be determined by dividing the mass by the volume (D = M/V). From a density calculation, we may tell whether a substance will float or sink in another liquid. A less dense substance will float on one that is denser. An example is oil floating on water. Oil is less dense than the water. For solids that have an irregular shape, the displacement method must be used to determine their volume. When using the displacement method, you must first measure the starting volume of the liquid. Then add the object and record the change in volume. This gives the volume of the irregularly-shaped object. Hypothesis The density of objects can be determined by a method known as water displacement. Materials Triple beam or electronic balance Methods
Results & Data Data Table 1
Questions
a. mass? b. Volume? c. density?
|
|||||||||||||||||||||||||||||||||
Who Ate the Cheese
Who Ate the Cheese?!
Introduction:
DNA isolation from blood, hair, skin cells, or other genetic evidence left at the scene of a crime can be compared with the DNA of a criminal suspect to determine guilt or innocence. This is due to the fact that every person has a different sequence. Scientists use a small number of sequences of DNA that are known to vary among individuals, and analyze those to get a possibility of a match. DNA is isolated, cut using restriction enzymes and sorted by size by gel electrophoresis. DNA is placed in a gel and an electrical charge is applied to the gel. The positive charge is at the top and the negative charge is at the bottom. Because DNA has a slightly negative charge, the pieces of DNA will be attracted to the bottom. The smaller pieces move more quickly towards the bottom than the larger pieces. The DNA can then be analyzed.
Objectives:
In this simulation you will examine crime scene evidence to determine who is responsible for eating the Queen’s special imported Lindbergher Cheese (yes, the stinky cheese). You will model the process of electrophoresis and DNA fingerprinting.
|
ROYAL GUARD INCIDENT REPORT
|
||||||||||||||||||||||||
Incident Data
Property
Burglary DataMethod of Entry: Unknown, no evidence of force on doors or windows. Narrative: The cheese was allegedly stolen from the Queen’s sitting room the night before the grand ball. The cheese was listed as a gift from the Manchurian diplomat. Officer Li Gase dusted for fingerprints and found none on the table or doors, the maid claimed that they had been wiped clean earlier. The wheel of cheese was on a platform in the sitting room, and half of it had been eaten. We took pictures of the half eaten cheese and sent it to the lab for further tests. Edna N. Zime, the lab technician said that saliva samples could be taken from the teeth imprints of the cheese that was left behind. Suspect DataSuspect Number: 1 Suspect Number 2 Suspect Number 3 Suspect Number 4 Crime Lab Data
Narrative: After receiving the package with the plastic bag marked Crime Scene, the DNA was extracted. Because the sample was so mall, the DNA was amplified using the polymerase chain reaction. We isolated the DNA from the four suspects and compared them to the crime scene DNA using DNA restriction analysis. Results: See attached DNA Results |
 DNA Evidence Evaluation:
1. Turn your paper strips (DNA sequences) so that the side with the bases is facing you. The restriction enzyme cuts at every point it finds C C G G, always cutting between the C and the G. Label the back of the slips with the suspect number so that you don’t get them confused after cutting. Use scissors to cut the DNA sequence at the C C G G points.
2. Count the number of base pairs (bp) in each piece of DNA that you created. Record the base pair number on the back side of the DNA fragment.
3. Make an enlarged chart like the one shown. Your teacher will give you paper for this. Use a ruler to ensure that the lengths are uniform.
4. Tape your DNA fragments to the chart, using the base pair numbers as a guideline for fragment placement.
5. Compare the crime scene DNA to the suspects and indicate on your chart, which suspect is guilty of eating the cheese.

ANALYSIS:
1. On your chart, label the positive (+) and the negative (-) ends. Circle the suspect’s DNA who matches the DNA at the crime scene and write the name of the suspect.
2. For each of the following tasks performed in the activity, describe what they are actually simulating.
Cutting the DNA into fragments:
Taping the DNA onto the large paper:
3. For each word below, describe how it relates to DNA Fingerprinting:
Polymerase Chain Reaction:
Gel Electrophoresis:
Restriction Enzyme:
What is Ecology PPT Questions
What is Ecology?
By Susan Lundy
1. Definition:
2. It ________________ how living organism affect each other and the world they live in.
3. ____________________ is the place a plant or animal lives in.
4. ____________________ is an organism’s total way of life (its job)
5. ____________________ factors are the nonliving parts of an organism’s environment.
6. 4 Examples of abiotic factors are:
7. _____________________ factors are all the living organisms that inhabit an environment.
8. Some things that organism’s rely on each other are _________________, ______________________, __________________ or _________________
9. What are the levels of simple organization from simplest to most complex?
10. _________________________ have organized the interactions an organism takes part in to different levels according to ________________
11. Level 1 Organism:
12. Level 2 Population:
13. Level 3 Biological Community:
14. Level 4 Ecosystem:
15. Level 5 Biosphere:
16. Where can you find life?