AP Sample Lab 2 Catalysis 3


Lab 2    Enzyme Catalysis


Introduction

The human body produces many things to keep it alive and healthy. Enzymes are proteins produced by living cells. Enzyme-catalysis binds with the active site of an enzyme, reducing the amount of energy needed to have a reaction with the substrate. Catalysis is a substance that lowers reaction energy and allows the reaction to take place in less time and at lower temperatures. Without catalysis people would die from poisons that the body produces, but would not be able to break down. Catalysis does not break down during a reaction so can be used reversibly (E is enzyme, S is substrate, and P is Product):

E+S↔ES↔E+P

Even with catalysis, enzyme reactions can be affected by many factors: salt concentration, pH, temperature, substrate concentration, enzyme concentration, activators, and inhibitors. Salt concentration affects the enzyme if it is to high or to low. Not enough salt will cause the enzyme side chains to become attracted to each other and denaturalizes it. Too much salt blocks the action site of the enzyme. The pH of a substance is determined by the amount of hydrogen (H+) in it. The scale ranges from 0-14: 0-7 is acidic, 7 is neutral, and 7-14 is basic. If the pH is too basic, the enzyme gains (H+) and eventually denaturalizes. If the pH is too acidic, then the enzyme loses (H+) and becomes denaturalized. The ideal pH is between 6 and 8. Temperature affects the kinetic energy that causes the reaction to speed up or slow down. In general, the higher the temperature the faster the molecular reaction. If the enzyme raises to a temperature above its optimum level, the tertiary structure of the protein is destroyed (denaturing it). Most enzymes denaturalize around 40-50°C. The law of mass action states the direction of enzyme-catalyzed reaction is dependent on conservation of enzyme/substrate/product. For example, when the substance has high substrate and low product, the substrate is used and more products are made. When the product is high and enzyme low, the reaction reverses and produces more substrate. If the product is immediately metabolized or removed from the cell, there will be no substrate formed. Activators increase the rate of a reaction while inhibitors slow the rate of the reaction. Inhibitors unfold an enzyme or reduce the –S-S- chains that stabilize the enzyme’s structure. Some enzyme inhibitors are poisons like potassium cyanide and curare.

Even without catalase, a reaction will still occur, but slower. The study of kinetics helps to determine the amount of product or substrate formed.

Chemical reactions occur over periods of time. The first three minutes of the reaction, the rate of change stays about the same. After a while, when there is less substrate, the reaction slows down and the rate of change becomes less. To compare the change of kinetic energy between reactions, a common point must be obtained. The first part of the reaction is called the initial rate of change. The initial rate of any enzyme-catalyzed reaction can be determined by the characteristics of the enzyme molecule. This is always the same for any enzyme and substrate at the same temperature and pH, but the substrate must have an excessive amount.

Chemical reactions can be studied by measuring the disappearance of the substrate, the rate of appearance by the product, or measuring the release or the absorbence of heat. For example, hydrogen peroxide (H2O2) is converted to water (H2O) and oxygen (O2) gas. Catalysis speeds up the reaction and sulfuric acid (H2SO4) stops the reaction by lowering the pH and denaturalizing the enzyme. Potassium permanganate (KmnO4) measure the presence of H2O2:
5 H2O2 + 2 KmnO4 +3 H2SO4 → K2SO4 + 2 MnSO4 + 8 H2O + 5 O2

After a certain amount of KmnO4 is added and the substance reaches a permanent brown or pink, no more KmnO4 should be added because it can mot be broken down.


Hypothesis:


Under perfect conditions, the rate of enzyme-catalysis should denature most of the hydrogen peroxide in a short amount of time.


Materials:


Exercise 2A


In Part 1, 10 mL of 1.5% of H2O2, a 50 mL beaker, and 1 mL of catalysis are needed. In Part 2, 5mL of catalysis, a water bath, and 10 mL of 1.5% H2O2 is needed. In Part 3, a 1 cm³ of liver, 50 mL beaker, and 10 mL of 1.5% H2O2. For all three parts, safety goggles, lab aprons, pencil, paper, erasers, and paper towels are needed.


Exercise 2B


To do this experiment, 10 mL of 1.5% H2O2, 1 mL of water, 10 mL of H2SO4, 50 mL beaker, 25 mL beaker, 5 mL syringe, and KmnO4 are needed. Safety goggles, lab aprons, pencil, paper, erasers, and paper towels are also needed.


Exercise 2C


To do this exercise, safety goggles, lab aprons, pencil, paper, erasers, paper towels, about 20 mL of 1.5% H2O2, 1 mL of H2O, 10 mL of H2SO4, 50 mL beaker, 25 mL beaker, 5 mL syringe, and KmnO4 are needed.


Exercise 2D


To do this experiment, about 60 mL of 1.5% H2O2, 6 mL of catalysis, 60 mL of H2SO4, 12 cups labeled 10, 30, 60, 120, 180, and 360 seconds, six cups labeled acid, a black marker, and a timer are needed. Safety goggles, lab aprons, pencil, paper, erasers, and paper towels will be needed, also.


Methods: * Remember to wear the goggles and apron. *


Exercise 2A

In Part 1, transfer 10 mL of 1.5% H2O2 a 50 mL glass beaker and add 1 mL of freshly made catalase to the solution. Remember to keep the catalase solution on ice at all times. Record the observations made. In Part 2, transfer 5 mL of the purified catalase extract to a test tube and place it in a boiling water bath for five minutes. Next, transfer 10 mL of 1.5% H2O2 into a 50 mL beaker and add 1 mL of the cooled, boiled catalase solution. Again record the results. In Part 3, cut 1 cm of liver, transfer it into a 50 mL glass beaker containing 10 mL of 1.5% H2O2, and mix it. Record the results.


Exercise 2B


To form a baseline for this experiment, put 10 ml of 1.5% H2O2 into a clean glass beaker. Add 1 mL of H2O and then add 10 mL of H2SO4 (1.0 M). Be careful when using acid. Mix this solution well. Remove a 5 mL sample and place it into another beaker. Assay for the amount of H2O2 as follows. Place the beaker containing the sample over white paper and use a 5 mL syringe to add one drop of KMnO4 at a time to the solution until it becomes a persistent pink or brown color. Gently swirl the solution after adding each drop. Record all results.


Exercise 2C


To determine the rate of spontaneous conversion of H2O2 to H2O and O2 in an uncatalyzed reaction, put about 20 mL of 1.5% H2O2 in a beaker. Store it uncovered at room temperature for approximately 24 hours. Put 10 ml of 1.5% H2O2 into a clean glass beaker (using the uncatalyzed H2O2 that set out). Add 1 mL of H2O and then add 10 mL of H2SO4 (1.0 M). Be careful when using acid. Mix this solution well. Remove a 5 mL sample and place it into another beaker. Assay for the amount of H2O2 as follows. Place the beaker containing the sample over white paper and use a 5 mL syringe to add one drop of KMnO4 at a time to the solution until it becomes a persistent pink or brown color. Gently swirl the solution after adding each drop. Record all results.


Exercise 2D

If a day or more has passed since Exercise B was performed, it is necessary to reestablish the baseline. Repeat the assay from Exercise B and record the results. Compare with other groups to check that results are similar. To determine the course of an enzymatic reaction, how much substrate is disappearing over time must be measured. The first thing to be done is to set up the cups labeled with times and acid. Add 10 mL of H2SO4 to each of the cups marked acid. Then put 10 mL of 1.5% H2O2 into the cup marked 10 sec. Add 1 mL of catalase extract to this cup. Swirl gently for 10 seconds (use the timer for accuracy). At 10 seconds, add the contents of one of the acid filled cups. Remove 5 mL and place in the second cup marked 10 sec. Assay the 5 mL sample by adding one drop of KMnO4 at a time until the solution turns a pink or brown. Repeat the above steps except allow the reactions to proceed for 30, 60, 120, 180, and 360 seconds, respectively. Use the times corresponding with the marked cups. Record all results and observations.

Results:

Table 1     Catalysis Activity


Experiment


Observations

H 2O2 and Fresh Catalase Small amount of bubbles
H 2O2 and Boiled Catalase Little or no bubbling
Catalase with Liver Very bubbly or reactive


Table 2     Baseline Assay


Baseline Calculations

Final Reading of Burette 1.5 mL
Initial Reading of Burette 5.0 mL
Baseline (Final-Initial) 3.4 mL of KmnO4


Table 3     The Uncatalyzed Rate of H2O2 Decomposition


Final Reading of Burette 2.2 mL
Initial Reading of Burette 7.0 mL
Amount of KMnO4 Titrant 4.8 mL
H2O2 Spontaneously Decomposed 1.3 mL
Percentage Spontaneously Decomposed in 24 hours 62.9%


Table 4     New Baseline


Baseline Calculations

Final Reading of Burette 1.4 mL
Initial Reading of Burette 5.0 mL
Baseline (Final-Initial) 3.6 mL of KmnO4


Table 5     Catalyzed Rate of H2O2 Decomposition


Time (seconds)


10


30


60


120


180


360


A. Baseline

3.6 mL 3.6 mL 3.6 mL 3.6 mL 3.6 mL 3.6 mL
 

B. Final Reading

1.2 mL 1.4 mL 1.8 mL 1.9 mL 2.4 mL 2.8 mL
 

C. Initial Reading

5 mL 5 mL 5 mL 5 mL 5 mL 5 mL
 

D. Amount of KmnO4 Consumed (B-C)

3.8 mL 3.6 mL 3.2 mL 3.1 mL 2.6 mL 2.2 mL
 

E. Amount of H2O2 Used (A-D)

.2 mL 0 mL .4 mL .5 mL 1.0 mL 1.4 mL


Graph 1    Affect of Time on Enzyme-Catalyzed H2O2 (Remaining amount)


Exercise 2A


(a) What is the enzyme in this reaction?

The enzyme in the reaction is catalase.

(b) What is the substrate in this reaction?

The substrate in the reaction is hydrogen peroxide.

(c) What is the product in this reaction?

The products in the reaction are water and oxygen gas.

(d) How could you show that the gas evolved is O2?

The formula 2 H202 + catalase →2 H2O + O2 proves that water and oxygen gas can only be produced.

How does the reaction compare to the one using unboiled catalysis? Explain the reason for the difference.

The boiled catalysis was not as reactive as the regular catalysis, because boiling the catalysis denatures it.

What do you observe? What do you think would happen if the liver was boiled before being added to the H2O2?

The liver has a high amount of catalase in it causing it to be very reactive when put with hydrogen peroxide. If the liver was boiled first, the catalysis would have been denatured and would not have reacted as much as previously.


Exercise 2D


1) From the formula described earlier recall that rate = G y/G x. Determine the initial rate of the reaction and the rates between each of the time points. Record the rates in the table below.

Time Intervals (seconds)
Initial 0-10 10-30 30-60 60-120 120-180 180-360
Rates .38 -.01 -1/75 -1/1600 -1/120 -1/450


2) When is the rate the highest? Explain why.

The rate is the highest at initial to 10, because of the high concentration of catalysis.

When is the rate the lowest? For what reason is the rate low?

The rate is the lowest at 30 to 60 seconds, because the concentration of calase and the concentration of the product are beginning to balance each other out.

Explain the inhibiting effect of sulfuric acid on the function of the catalysis. Relate this to enzyme structure and chemistry.

The sulfuric acid changes the pH of the catalase function and causes it to denature. Most enzymes work in a range of 6 to 8 and by adding the acid, the pH drops too low.

Predict the effect of lowering the temperature would have on the rate of the enzyme activity. Explain your prediction.

Lowering the temperature would slow the reaction. If the temperature is lowered a great deal (below 40ºC) it will be denatured.

Design a controlled experiment to test the effect of varying pH, temperature, or enzyme concentration.

To test the effect of temperature on enzymes: put 5 mL of catalase in the freezer until it is completely frozen, add 1 mL of catalase to 10 mL of 1.5% H2O2 (which is in a 50 mL beaker). Watch and record results.


Error of Analysis:


Errors in this experiment could have come from inaccurate measurements and timing. Also the catalase not being frozen when received most likely affected the data.


Discussion and Conclusion:


The purpose of this lab was to show the decomposition of hydrogen peroxide under different circumstances. Exercise 2A showed the affects of catalysis (added to and from living cells) in hydrogen peroxide. In Exercise 2B, the baseline was determined for the experiment (3.5). In Exercise 2C, the natural decomposition of hydrogen peroxide was viewed and found to be slower that when catalyzed. In Exercise 2D, a new baseline was made (3.6) and the decomposition of hydrogen peroxide with a catalase, over six minutes, was discovered to decompose more rapidly than an uncatalyzed reaction over 24 hours.

BACK


AP Sample Lab 2 Catalysis 2


Lab 2    Enzyme Catalysis


Introduction:


Enzymes are proteins produced by living cells. They are biochemical catalysts meaning they lower the activation energy needed for a biochemical reaction to occur. Because of enzyme activity, cells can carry out complex chemical activities at relatively low temperatures. The substrate is the substance acted upon in an enzyme-catalyzed reaction, and it can bind reversibly to the active site of the enzyme. The active site is the portion of the enzyme that interacts with the substrate so that any substrate that blocks or changes the shape of the active sit effects the activity of the enzyme. The result of this temporary union is a reduction in the amount of energy required to activate the reaction of the substrate molecule so that products are formed. The following equation demonstrates this process: E + S ↔ ES ↔ E + P Enzymes follow the law of mass reaction. Therefore, the enzyme is not changed in the reaction and can be recycled to break down additional substrate molecules.

Several factors can affect the action of an enzyme: salt concentration, pH of the environment, temperature, activations and inhibitors. If salt concentration is close to zero, the changed amino acid side chains of the enzyme molecules will attract one another. The enzyme will then denature and form an inactive precipitate. Denaturation occurs when excess heat destroys the tertiary structure of proteins. This usually occurs at 40 to 50º Celsius. If salt concentration is high, the normal interaction of charged groups will be blocked. An intermediate salt concentration is normally the optimum for enzyme activity. The salt concentration of blood and cytoplasm are good examples of intermediate concentrations. The pH scale is a logarithmic scale that measures the acidity or H+ concentration in a solution and runs from 0 to 14, with 0 being highest in acidity and 14 lowest. Amino acid side chains contain groups such as –COOH that readily gain or lose H+ ions. As the pH is lowered an enzyme will tend to gain H+ ions, disrupting the enzyme’s shape. If the pH is raised, the enzyme will lose H+ ions and eventually lose its active shape. Reactions usually perform optimally in neutral environments. Chemical reactions generally speed up as the temperature is raised. More of the reacting molecules have enough kinetic energy to undergo the reaction as the temperature increases. However, if the temperature goes above the temperature optimum, the conformation of the enzyme molecules is disrupted. An activator is a coenzyme that increases the rate of the reaction and can regulate how fast the enzyme acts. It also makes the active site a better fit for the substrate. An inhibitor has the same power of activator regulation but decrease the reaction rate. An inhibitor also reduces the number of S-S bridges and reacts with the side chains near activation sites, blocking them.

The enzyme used in this lab is catalase. It has four polypeptide chains that are each composed of more than 500 amino acids. One catalase function is to prevent the accumulation of toxic levels of hydrogen peroxide formed as a by-product of metabolic processes. Many oxidation reactions that occur in cells involve catalase. The following is the primary reaction catalyzed by catalase, the decomposition of hydrogen peroxide to form water and oxygen:

2 H2O2 → 2 H2O + O2 (gas) Without catalase this reaction occurs spontaneously but very slowly. Catalase speeds up the reaction notably.

The direction of an enzyme-catalyzed reaction is directly dependent on the concentration of enzyme, substrate, and product. For example, lots of substrate with a little product makes more product. Another example is lots of product with a little enzyme forms more substrate. Much can be learned about enzymes by studying the kinetics of enzyme-catalyzed reaction. It is possible to measure the amount of product formed, or the amount of substrate used, from the moment the reactants are brought together until the reaction has stopped.


Hypothesis:

Enzyme catalase, when working under optimum conditions, noticeably increases the rate of hydrogen peroxide decomposition.


Materials:


Exercise 2A

The materials needed for exercise 2A of the lab are: 30 mL of 1.5% (0.44 M) H2O2, a 50- mL glass beaker, 6 mL of freshly made catalase solution, a test tube, boiling water bath, 1 cm³ of liver, a knife for maceration, paper towels, safety goggles, lab apron, pencil, eraser, and paper to record results.

Exercise 2B

The materials needed for exercise 2B are: 10 mL of 1.5% H2O2, two clean glass beakers, 1 mL of H2O, 10 mL of H2SO4, a white sheet of paper, a 5 mL syringe, approximately 5 mL of KMnO4, paper, pencil, eraser, safety goggles, and lab aprons.

Exercise 2C

The materials needed for exercise 2C of the lab are: 20 mL of 1.5% H2O2, two glass beakers, 1 mL of H2O, 10 mL of H2SO4, a white sheet of paper, a 5 mL syringe, approximately 5 mL of KMnO4, paper, pencil, eraser, safety goggles, and lab aprons.

Exercise 2D

For this part of the experiment, the materials needed are 12 cups labeled 10, 30, 60, 120, 180, and 360 on two each, six cups labeled acid, 60 mL of 1.5% H2O2, a clean 50-mL beaker, 6 mL of catalase extract, two 5-mL syringes, KMnO4, a timer, paper, pencil, black marker, eraser, safety goggles, and lab aprons.


Methods:


Exercise 2A

Transfer 10 mL of 1.5% H2O2 into a 50-mL glass beaker and add 1 mL of freshly made catalase solution. Remember to keep the catalase solution on ice at all times. Record the results. Then transfer 5 mL of purified catalase extract to a test tube and place it in a boiling water bath for five minutes. Transfer 10 mL of 1.5% H2O2 into a 50-mL beaker and add 1 mL of the cooled, boiled catalase solution. Again record the results. To demonstrate the presence of catalase in living tissue, cut 1 cm of liver, macerate it, and transfer it into a 50-mL glass beaker containing 10 mL of 1.5% H2O2. Record these results.

Exercise 2B

Put 10 ml of 1.5% H2O2 into a clean glass beaker. Add 1 mL of H2O. Add 10 mL of H2SO4 (1.0 M) using extreme caution. Mix this solution well. Remove a 5 mL sample and place it into another beaker. Assay for the amount of H2O2 as follows. Place the beaker containing the sample over white paper. Use a 5-mL syringe to add KMnO4 a drop at a time to the solution until a persistent pink or brown color is obtained. Remember to gently swirl the solution after adding each drop. Record all results. Check with another group before proceeding to see that results are similar.

Exercise 2C

To determine the rate of spontaneous conversion of H2O2 to H2O and O2 in an uncatalyzed reaction, put about 20 mL of 1.5% H2O2 in a beaker. Store it uncovered at room temperature for approximately 24 hours. Repeat the steps from Exercise 2B, using the uncatalyzed H2O2, to determine the proportional amount H2O2 of remaining after 24 hours. Record the results.

Exercise 2D

If a day or more has passed since Exercise B was performed, it is necessary to reestablish the baseline. Repeat the assay and record the results. Compare with other groups to check that results are similar. To determine the course of an enzymatic reaction, how much substrate is disappearing over time must be measured. First, set up the cups with the times and the word acid up. Add 10 mL of H2SO4 to each of the cups marked acid. Then put 10 mL of 1.5% H2O2 into the cup marked 10 sec. Add 1 mL of catalase extract to this cup. Swirl gently for 10 seconds. (Calculate time using the timer for accuracy.) At 10 seconds, add the contents of one of the acid filled cups. Remove 5 mL and place in the second cup marked 10 sec. Assay the 5-mL sample by adding KMnO4 a drop at a time until the solution obtains a pink or brown color. Repeat the above steps except allow the reactions to proceed for 30, 60, 120, 180, and 360 seconds, respectively. Use the times’ corresponding, marked cups. Record all results and observations.


Results:

Table 1: Test of Catalysis Activity


Experiment


Observations

Hydrogen Peroxide + Fresh Catalase Bubbling in solution with the release of oxygen.
Hydrogen Peroxide + Boiled Catalase No reaction occurred.
Hydrogen Peroxide + Liver Much bubbling in solution with the release of O2.


Table 2: Establishing a Baseline #1


Baseline Calculations (syringe contains KMnO4)


Readings

Final Reading of Syringe 1.2 mL
Initial Reading of Syringe 5.0 mL
Baseline 3.8


Table 3: Uncatalyzed H2O2 Decomposition


(Syringes Contain KMnO4)


Results

Final Reading of Syringe 1.3 mL
Initial Reading of Syringe 5.0 mL
Amount of H2O2 Spontaneously Decomposed 3.7 mL
Percent of H2O2 Spontaneously Decomposed in 24 Hours 94.3%


Table 4: Establishing a Baseline #2


Baseline Calculations (syringe contains KMnO4)


Readings

Final Reading of Syringe 1.5 mL
Initial Reading of Syringe 5.0 mL
Baseline 3.5


Table 5: Time-Course Determination


Potassium Permanganate (mL)

Time in Seconds

10 30 60 120 180 360
Baseline 3.5 3.5 3.5 3.5 3.5 3.5
Final Reading 1.3 1.6 1.8 2.0 2,4 2.7
Initial Reading 5.0 5.0 5.0 5.0 5.0 5.0
Amount of KMnO4 Consumed 3.7 3.4 3.2 3.0 2.6 2.3
Amount of H2O2 Used 0.2 0.1 0.3 0.5 0.9 1.2


Effect of Time on the Amount of H2O2 Remaining after an Enzyme Catalyzed Reaction

Exercise 2A:

1.a. What is the enzyme in this reaction? The enzyme in this reaction is the catalase solution.

1.b. What is the substrate in this reaction? The substrate is hydrogen peroxide.

1.c. What are the products in this reaction? The products are water and oxygen gas.

1.d. How could you show that the gas evolved is oxygen? Referring to the equation 2H2O2 + Catalase solution→H2O + O2, the only gas released is oxygen.

2. How does the reaction compare to the one using the unboiled catalase? Explain the reason for this difference. With the boiled catalase, there was no sign of bubbling because the catalase was denatured by the heat and caused no reaction.

3.a. What do you observe? I observe quite a bit of gas being released from the solution.

3.b. What do you think would happen if the liver were boiled before being added to the hydrogen peroxide? I think that no signs of a reaction occurring would be shown. The catalase that occurs naturally within the liver would have been denatured.

4. From the formula described earlier recall that rate = G y/G x . Determine the initial rate of the reaction and the rates between each of the time points. Record the rates in the table below.


Time Intervals (seconds)
Initial 0-10 10-30 30-60 60-120 120-180 180-360
Rates 37/100 -3/200 -1/150 -1/300 -1/150 -1/600


5. When is the rate the highest? Explain why. The rate is the highest in the first ten seconds because the rate decreases as the concentration of the catalase decreases over time.

6. When is the rate the lowest? For what reason is the rate low? The rate is lowest during the last time period of 360 seconds because the most time has passed. The catalase concentration has been reduced and the product amount has increased, blocking the enzymes from reacting with the hydrogen peroxide.

7. Explain the inhibiting effect of sulfuric acid on the function of the catalysis. Relate this to enzyme structure and chemistry. The sulfuric acid’s high concentration of H+ ions gives the acid a low pH. Because enzymes can only function in the pH range of six to eight, the addition of an acidic solution denatures the enzyme, stopping the reaction.

8. Predict the effect of lowering the temperature would have on the rate of the enzyme activity. Explain your prediction. Enzymes generally only work at the between the temperatures of forty and fifty degrees Celsius. Lowering the temperature would slow the reaction until the enzyme is denatured and no longer able to react.

9. Design a controlled experiment to test the effect of varying pH, temperature, or enzyme concentration.


Part One (the effects of a strong acid on enzyme activity): Add 10 mL of 1.5-% hydrogen peroxide to a 50-mL beaker, and add 1 mL of catalase solution. Mix well and then add 1 mL of (0.5 M) HCl to the beaker. Observe the reaction and record the results.

Part Two (the effects of a neutral solution on enzyme activity): Add 10 mL of 1.5-% hydrogen peroxide to a 50-mL beaker, and add 1 mL of catalase solution. Mix well and then add 1 mL of pure water with a pH of 7.0. Observe the reaction and record the results.


Part Three (the effects of a strong base on enzyme activity): Add 10 mL of 1.5-% hydrogen peroxide to a 50-mL beaker, and add 1 mL of catalase solution. Mix well and then add 1 mL of (0.5 M) NaOH to the beaker. Observe the reaction and record the results.


Error Analysis:

Several errors could have occurred throughout the experiment. Miscalculations involving numbers and amounts of solutions would have a severe effect upon the results. Mathematical errors may also have of occurred. When the catalase arrived, it had melted. Because it is to remain on ice at all times, this may have caused errors. The age of the hydrogen peroxide effected results. For example, when calculating the percent of hydrogen peroxide spontaneously decomposed after 24 hours, new hydrogen peroxide yielded a much higher percentage than the aged hydrogen peroxide. Errors occur in every experiment and that is why is it is necessary to repeat an experiment several times for the most accurate results.

Discussion and Conclusion:

Catalase, or enzymes, drastically increases the rate of hydrogen peroxide decomposition. This lab shows how catalase added to hydrogen peroxide leads to the release of oxygen, boiled catalase is denatured, and the presence of catalase in living things can lead to the breaking down of hydrogen peroxide in the body. In the lab it was shown that the natural decomposition hydrogen peroxide is slower than decomposition taking place with the addition of enzymes. If hydrogen peroxide was required to decompose naturally, life could not survive. The addition of catalase increases this decomposition rate allowing life to continue.

BACK


AP Sample Lab 12 Dissolved Oxygen


Dissolved Oxygen and Primary Aquatic Productivity
Laboratory 12


Introduction


Dissolved oxygen levels are an extremely important factor in determining the quality of an aquatic environment. Dissolved oxygen is necessary for the metabolic processes of almost every organism.

Terrestrial environments hold over 95% more oxygen than aquatic environments. Oxygen levels in aquatic environments are very vulnerable to even the slightest change. Oxygen must be constantly be replenished from the atmosphere and from photosynthesis. There are several factors that effect the dissolved oxygen levels in aquatic environments.

Temperature is inversely proportional to the amount of dissolved oxygen in water. As temperature rises, dissolved oxygen levels decrease.

Wind allows oxygen to be mixed into the water at the surface. Windless nights can cause lethal oxygen depletions in aquatic environments.

Turbulence also increases the mixture of oxygen and water at the surface. This turbulence is caused by obstacles, such as rocks, fallen logs, and water falls, and can cause extreme variations in oxygen levels throughout the course of a stream.

The Trophic State is the amount of nutrients in the water. There are two classifications: oligotrophic and eutrophic. Oligotrophic lakes are oxygen rich, but generally nutrient poor. They are clearer and deeper than eutrophic lakes and are younger. Oxygen levels are constant. Eutrophic lakes are more shallow and nutrient rich. The oxygen levels constantly fluctuate from high to low.

Primary production is the energy accumulated by plants since it is the first and basic form of energy storage. The flow of energy through a community begins with photosynthesis. All of the sun’s energy that is used is termed gross primary production. The energy remaining after respiration and stored as organic matter is the net primary production, or growth. The equation for photosynthesis is as follows:

12H2O + 6CO2 → C6H12O6 + 6O2 + 6H2O

There are two ways to measure primary production, the oxygen method and the carbon dioxide method. The oxygen method uses a dark and light bottle to compare the amount of oxygen produced in photosynthesis and used in respiration. Respiration rate is determined by subtracting the dark bottle from the initial bottle. The carbon dioxide method places a transparent plastic bag over one sample and a dark plastic bag over the other. Each bottle is set up so that air is drawn through the enclosure and passes over carbon dioxide-absorbent material. The amount of carbon under the dark bag is respiration, while the amount of carbon under the transparent bag is the amount of photosynthesis minus the amount of respiration.

There are three main gases dissolved in aquatic environments: nitrogen, oxygen, and carbon dioxide. Most gases obey Henry’s law, which says that at a constant temperature, the amount of gas absorbed by a given volume of liquid is proportional to the pressure in the atmosphere that the gas exerts.

c = K ×p

                                                             c = Concentration of the gas that is absorbed

K = Solubility factor

                     p = Partial pressure of the gas


Altitude may affect the p value of the equation. Higher altitudes decrease the solubility of gases in water. Temperature also has an affect, as temperature rises, solubility decreases. Salinity, the occurrence of various minerals in solution, also lowers the solubility of gases in water.

The method used to determine the amount of dissolved oxygen in the water is the Winkler titrametric method. It involves a series of chemical reactions which ends with a quantity of free iodine equal to the amount of oxygen in the sample. The iodine is then titrated with thiosulfate to find this quantity.


Hypothesis

The temperature and amount of light an aquatic environment receives greatly affects the dissolved oxygen levels, along with the amount of primary aquatic productivity.


Materials


Measurement of Dissolved Oxygen

This part of the lab required a sample bottle of water from a natural source, a BOD bottle, thermometer, mangonous sulfate, alkaline iodide, thiosulfate, a 2-mL pipette, sulfuric acid, a 20-mL sample cup, a white piece of paper, starch solution, and a nomograph.

Measurement of Primary Productivity

Part B required a sample bottle of water from a natural source, 7 BOD bottles, aluminum foil, 17 cloth screens, rubber bands, a light, thermometer, concavity slides, light microscope, mangonous sulfate, alkaline iodide, thiosulfate, a 2-mL pipette, sulfuric acid, a 20-mL sample cup, a white piece of paper, starch solution, and a nomograph.

Productivity Simulation

This section required pencil, paper, calculator, and graph paper.


Methods


Measurement of Dissolved Oxygen

The sample bottle was filled completely so that there were no air bubbles in the bottle. The sample bottle was left in the refrigerator until it reached 5° C. A BOD bottle was filled with the sample water until it contained no air bubbles.

Eight drops of mangonous sulfate were added to the bottle. Next, eight drops of alkaline iodide was added and the precipitate manganous hydroxide was formed. The bottle was inverted several times and then allowed to settle until the precipitate was below the shoulders of the bottle. While the solution was settling, a 2mL pipette was filled with thiosulfate. A scoop of sulfuric acid was added, and the bottle was inverted until all of the precipitate dissolved. The sample turned a clear yellow.

20mL of the sample were poured into the sample cup. The cup was placed on a white sheet of paper so that the color changes could be observed. 8 drops of starch solution were added to the sample, making it turn purple. The sample was then titrated with the thiosulfate. One drop of the titrant was added at a time until the color changed to a pale yellow color.

A nomograph was used to determine the percent saturation of dissolved oxygen in the sample.

Measurement of Primary Productivity

A second sample bottle was filled from a natural source making sure there were no air bubbles. Seven BOD bottles were filled completely with the sample with no air bubbles. The first bottle was labeled #1-Initial. The second bottle served as the dark bottle and was labeled #2-Dark. The other five bottles were labeled according to the light intensity: #3-100%, #4-65%, #5-25%, #6-10%, and #7-2%.

Bottle #2 was wrapped completely in aluminum foil so that it received no light. The other five bottles were wrapped in screens to produce the desired light intensity. Bottle #3 had no screens, bottle #4 had 1 screen, bottle #5 had 3 screens, bottle #6 had 5 screens, and bottle #7 had 8 screens. The screens were held in place with rubber bands. Bottles #2-7 were placed under a light source and left overnight.

Bottle #1 was fixed by following the Winkler method. Eight drops of mangonous sulfate were added to the bottle. Next, eight drops of alkaline iodide was added and the precipitate manganous hydroxide was formed. The bottle was inverted several times and then allowed to settle until the precipitate was below the shoulders of the bottle. A scoop of sulfuric acid was added, and the bottle was inverted until all of the precipitate dissolved. The sample turned a clear yellow. It was left at room temperature until the other samples were processed.

A wet mount was observed under a light source, so that the different organisms present could be identified.

The next day, bottles #2-7 were fixed by following the same method used on Bottle #1. The dissolved oxygen levels were determined in each of the seven bottles by titrating. 20mL of the sample were poured into the sample cup. The cup was placed on a white sheet of paper so that the color changes could be observed. 8 drops of starch solution were added to the sample, making it turn purple. The sample was then titrated with the thiosulfate. One drop of the titrant was added at a time until the color changed to a pale yellow color.

Productivity Simulation

The respiration data from Part B was converted to carbon productivity. The data was graphed with comparison to water depths.


Results


A. Measurement of Dissolved Oxygen


Table 1

Dissolved Oxygen Concentration


Temperature


Dissolved Oxygen (mg/l)


% Dissolved Oxygen


5° C

2.0 mg/l 16%
 

21.5° C

1.28 mg/l 19%


How does temperature affect the solubility of oxygen in water?


As temperature goes up the solubility of oxygen in water goes down. They are inversely proportional.


How does salinity affect the solubility of oxygen in water?


The occurrence of various minerals in solution lowers the solubility of oxygen in water.


Would you expect to find a higher dissolved oxygen content in a body of water in winter or summer?


Oxygen levels would be higher in the winter because the solubility of oxygen in water is higher at lower temperatures.


List and discuss three factors that could influence the dissolved oxygen concentration of a body of water.


Temperature-As temperature goes up solubility goes down.

Pressure- As pressure decreases solubility decreases. Pressure is directly affected by altitude

Salinity-The occurrence of various minerals in solution lowers the solubility of oxygen in water.


Do you think it would be wise to stock a pond with game fish if it had a dissolved oxygen content of 3ppm? Why or why not?


It would not be wise to stock a pond with an oxygen level of 3ppm with game fish because their optimal levels range from 8 to 15ppm. A concentration of dissolved oxygen less than 4ppm is stressful to most forms of aquatic life.

B. Measurement of Primary Productivity


Respiration Rate = 4.6 ml O2/l


Table 3

Gross and Net Productivity/ Respiration Rate


Percent Light


Dissolved Oxygen


Gross Productivity


Net Productivity


Gross Productivity (mg C/m3)


Initial

9.2 ml O2/l NA NA NA
 

Dark

4.6 ml O2/l NA NA NA
 

100%

6.4 ml O2/l 1.8 ml O2/l -2.8 ml O2/hr 0.965 mg C/m3
 

65%

3.8 ml O2/l -0.8 ml O2/l -5.4 ml O2/hr -0.429 mg C/m3
 

25%

4.5 ml O2/l -0.1 ml O2/l -4.7 ml O2/hr -0.054 mg C/m3
 

10%

3.7 ml O2/l -0.9 ml O2/l -5.5 ml O2/hr -0.482 mg C/m3
 

2%

4.0 ml O2/l -0.6 ml O2/l -5.2 ml O2/hr -0.322 mg C/m3


Were any of the samples light limited? Why?


Each sample was given a certain amount of light by the use of aluminum foil and screen. Bottle #2 received no light, because it was covered with aluminum foil. Bottles #3-7 had varying numbers of screen ranging from 100% to 2% light intensity.

Productivity Simulation


Based on your analysis, which lake is more productive?


Lake 2 would be more productive because there is more oxygen available in the lower layers than in Lake 1.


What is used as the basis for measuring primary productivity?


Primary productivity is measured by the amount of dissolved oxygen available in the water. This shows the amount of oxygen produced by photosynthesis and the amount used by respiration.


Error Analysis


The Part A experiment was affected mainly by human error and inexperience with the Winkler method. The sample may have been over exposed to the air or the temperature may have changed before the fixing procedure was finished.

The original Part B experiment performed was unsuccessful. There were substantially more decomposing bacteria than photosynthetic organisms in the water sample use. The initial dissolved oxygen level was only 0.84 causing the other samples to have little or no oxygen. The amount of oxygen was so low that it was unable to form the free iodine and could not be titrated. This left no quantifiable data to use in graphs and tables.


Discussion and Conclusion


Temperature is inversely proportional to the solubility of gases in water. As temperature rose the dissolved oxygen levels should have decreased. This was qualified in the data obtained from this experiment, as the 5° C water sample measured 2.0 mg/l and the 21.5° C sample measured 1.28 mg/l. The percent saturation showed that even though the 5° C sample contained more oxygen it was still less saturated than the 21.5° C sample.

Part B of the lab was used to measure dissolved oxygen concentration, gross and net productivity, and respiration rate of the water samples. It also demonstrated the effect of light and nutrients on photosynthesis. In aquatic environments oxygen production and oxygen usage must be balanced to prevent anoxia. In the original experiment this balance was interrupted by the limiting of light by screens and aluminum foil. The amount of respiration in all of the bottles exceeded the amount of photosynthesis occurring. This was due to the types of organisms present in the sample, which was mainly decomposing bacteria and protozoan. The experiment was correct in its methods however the data received was not quantifiable. This absence of sufficient oxygen in the water samples is an indicator of poor water quality, which may require further investigation. Excess pollution or dumping of wastes into the water sample is a suspected cause of the poor water quality.

The data used in this report shows that as more light was limited, there was less dissolved oxygen present in the water. This is caused because photosynthesis cannot occur without sufficient light.

BACK


AP Lecture Guide 02 & 03 – Chemical Context of Life & Water

AP Biology: CHAPTERS 2 & 3

CHEMICAL CONTEXT OF LIFE & WATER

1. What are the most common elements in the human?

__________________________________________________________________________

__________________________________________________________________________

2. Helium has an atomic number of 2 and atomic mass of 4. Explain.

__________________________________________________________________________

__________________________________________________________________________

3. Define isotope and give some examples.

__________________________________________________________________________

__________________________________________________________________________

__________________________________________________________________________

4. How are isotopes used in biology?

__________________________________________________________________________

__________________________________________________________________________

__________________________________________________________________________

5. What happens when electrons change levels?

__________________________________________________________________________

__________________________________________________________________________

__________________________________________________________________________

6. What is the significance of valence numbers?

__________________________________________________________________________

__________________________________________________________________________

__________________________________________________________________________

7. Why do atoms form covalent vs. ionic bonds?

__________________________________________________________________________

__________________________________________________________________________

__________________________________________________________________________

8. How do non-polar covalent bonds differ from polar covalent bonds?

__________________________________________________________________________

__________________________________________________________________________

__________________________________________________________________________

9. What is a hydrogen bond? How does it form and how is it different from a covalent bond?

__________________________________________________________________________

__________________________________________________________________________

__________________________________________________________________________

10. Sketch a few molecules of water, indicate their polarity, and where H bonds form.


11. Why is H bonding so important to water’s properties?

__________________________________________________________________________

__________________________________________________________________________

__________________________________________________________________________

12. List the “special” properties of water and give an example of why the property may be

important to living things.

a. ________________________________________________________________________

__________________________________________________________________________

__________________________________________________________________________

__________________________________________________________________________

b. ________________________________________________________________________

__________________________________________________________________________

__________________________________________________________________________

__________________________________________________________________________

c. ________________________________________________________________________

__________________________________________________________________________

__________________________________________________________________________

__________________________________________________________________________

d. ________________________________________________________________________

__________________________________________________________________________

__________________________________________________________________________


AP Sample 5 Lab 5 Cellular Respiration


Lab 5     Cellular Respiration


Introduction:


Cellular respiration is an ATP-producing catabolic process in which the ultimate electron acceptor is an inorganic molecule, such as oxygen. It is the release of energy from organic compounds by metabolic chemical oxidation in the mitochondria within each cell. Carbohydrates, proteins, and fats can all be metabolized as fuel, but cellular respiration is most often described as the oxidation of glucose, as follows:

C6H12O6 + 6O2 → 6CO2 + 6H2O + 686 kilocalories of energy/mole of glucose oxidized

Cellular respiration involves glycolysis, the Krebs cycle, and the electron transport chain. Glycolysis is a catabolic pathway that occurs in the cytosol and partially oxidizes glucose into two pyruvate (3-C). The Krebs cycle is also a catabolic pathway that occurs in the mitochondrial matrix and completes glucose oxidation by breaking down a pyruvate derivative (Acetyl-CoA) into carbon dioxide. These two cycles both produce a small amount of ATP by substrate-level phosphorylation and NADH by transferring electrons from substrate to NAD+ (Krebs cycle also produces FADH2 by transferring electrons to FAD). The electron transport chain is located at the inner membrane of the mitochondrion, accepts energized electrons from reduced coenzymes that are harvested during glycolysis and Krebs cycle, and couples this exergonic slide of electrons to ATP synthesis or oxidative phosphorylation. This process produces 90% of the ATP.

Cells respond to changing metabolic needs by controlling reaction rates. Anabolic pathways are switched off when their products are in ample supply. The most common mechanism of control is feedback inhibition. Catabolic pathways, such as glycolysis and the Krebs cycle, are controlled by regulating enzyme activity at strategic points. A key control point of catabolism is the third step of glycolysis, which is catalyzed by an allosteric enzyme, phosphofructokinase. The ratio of ATP to ADP and AMP reflects the energy status of the cell, and phosphofructokinase is sensitive to changes in this ratio. Citrate and ATP are allosteric inhibitors of phosphofructokinase, so when their concentration rise, the enzyme slows glycolysis. As the rate of glycolysis slows, the Krebs cycle also slows since the supply of Acetyl-CoA is reduced. This synchronizes the rates of glycolysis and the Krebs cycle. ADP and AMP are allosteric activators for phosphofructokinase, so when their concentrations relative to ATP rise, the enzyme speeds up glycolysis, which speeds of the Krebs cycle.

Cellular respiration is measure in three manners: the consumption of O2 (how many moles of O2 are consumed in cellular respiration?), production of CO2 (how many moles of CO2 are produced in cellular respiration?), and the release of energy during cellular respiration.

PV = nRT is the formula for the inert gas law, where P is the pressure of the gas, V is the volume of the gas, n is the number of molecules of gas, R is the gas constant, and T is the temperature of the gas in degrees K. This law implies several important things about gases. If temperature and pressure are kept constant then the volume of the gas is directly proportional to the number of molecules of the gas. If the temperature and volume remain constant, then the pressure of the gas changes in direct proportion to the number of molecules of gas. If the number of gas molecules and the temperature remain constant, then the pressure is inversely proportional to the volume. If the temperature changes and the number of gas molecules is kept constant, then either pressure or volume or both will change in direct proportion to the temperature.

Hypothesis:


The respirometer with only germinating peas will consume the largest amount of oxygen and will convert the largest amount of CO2 into K2CO3 than the respirometers with beads and dry peas and with beads alone. The temperature of the water baths directly effects the rate of oxygen consumption by the contents in the respirometers (the higher the temperature, the higher the rate of consumption).


Materials:

The following materials are necessary for the lab: 2 thermometers, 2 shallow baths, tap water, ice, paper towels, masking tape, germinating peas, non-germinating (dry) peas, glass beads, 100 mL graduated cylinder, 6 vials, 6 rubber stoppers, absorbent and non- absorbent cotton, KOH, a 5-mL pipette, silicon glue, paper, pencil, a timer, and 6 washers.


Methods:
Prepare a room temperature and a 10oC water bath. Time to adjust the temperature of each bath will be necessary. Add ice cubes to one bath until the desired temperature of 10oC is obtained.

Fill a 100 mL graduated cylinder with 50 mL of water. Add 25 germinating peas and determine the amount of water that is displaced. Record this volume of the 25 germinating peas, then remove the peas and place them on a paper towel. They will be used for respirometer 1. Next, refill the graduated cylinder with 50 mL of water and add 25 non-germinating peas to it. Add glass beads to the graduated cylinder until the volume is equivalent to that of the expanded germinating peas. Remove the beads and peas and place on a paper towel. They will be used in respirometer 2. Now, refill the graduated cylinder with 50 mL of water. Determine how many glass beads would be required to attain a volume that is equivalent to that of the germinating peas. Remove the beads. They will be used in respirometer 3. Then repeat the procedures used above to prepare a second set of germinating peas, dry peas and beads, and beads to be used in respirometers 4,5,and 6.

Assemble the six respirometers by obtaining 6 vials, each with an attached stopper and pipette. Then place a small wad of absorbent cotton in the bottom of each vial and, using the pipette or syringe, saturate the cotton with 15 % KOH. Be sure not to get the KOH on the sides of the respirometer. Then place a small wad of non-absorbent cotton on top of the KOH-soaked absorbent cotton. Repeat these steps to make the other five respirometers. It is important to use about the same amount of cotton and KOH in each vial.

Next, place the first set of germinating peas, dry peas and beads and beads alone in vials 1,2, and 3. Place the second set of germinating peas, dry peas and beads, and glass beads in vials 4,5, and 6. Insert the stoppers in each vial with the proper pipette. Place a washer on each of the pipettes to be used as a weight.


Respirometer Temperature Contents
1 Room Germinating Peas
2 Room Dry Seeds + Beads
3 Room Beads
4 10oC Germinating Peas
5 10oC Dry Seeds + Beads
6 10oC Beads


Make a sling using masking tape and attach it to each side of the water baths to hold the pipettes out of the water during the equilibration period of 10 minutes. Vials 1,2, and 3 should be in the bath containing water at room temperature. Vials 4, 5, and 6 should be in the bath containing water that is 10oC. After the equilibration period, immerse all six respirometers into the water completely. Water will enter the pipette for a short distance and stop. If the water does not stop, there is a leak. Make sure the pipettes are facing a direction from where you can read them. The vials should not be shifted during the experiment and your hands should not be placed in the water during the experiment.

Allow the respirometers to equilibrate for three more minutes and then record the initial water reading in each pipette at time 0. Check the temperature in both baths and record the data. Every five minutes for 20 minutes take readings of the water’s position in each pipette, and record.


Results:

Table 1: Measurement of O2 Consumption by Soaked and Dry Pea Seeds at Room Temperature and 10˚C Using Volumetric Methods


Beads Alone

Germinating Peas

Dry Peas and Beads


Reading at time X


Diff.


Reading at time X


Diff.


Corrected Diff.∆


Reading at time X


Diff.


Corrected Diff.∆


Initial-0

1.38 1.35 1.47
 

0-5

1.38 0 1.16 .19 .19 1.46 .01 .01
 

5-10

1.38 0 1.04 .31 .31 1.44 .03 .03
 

10-15

1.38 0 0.93 .42 .42 1.43 .04 .04
 

15-20

1.38 0 0.57 .78 .78 1.42 .05 .05
 

Initial-0

1.40 1.32 1.40
 

0-5

1.39 .01 1.20 .12 .11 1.40 0 .01
 

5-10

1.38 .02 1.11 .21 .19 1.40 0 .02
 

10-15

1.38 .02 1.00 .32 .30 1.39 .01 .01
 

15-20

1.38 .02 0.95 .37 .93 1.38 .02 0


In this activity, you are investigating both the effects of germination versus non-germination and warm temperature versus cold temperature on respiration rate. Identify the hypothesis being tested on this activity. The rate of cellular respiration is higher in the germinating peas in cold than in the beads or non-germinating peas; the cooler temperature in the cold water baths slows the process of cellular respiration in the both germinating and non-germinating peas.

This activity uses a number of controls. Identify at least three of the controls, and describe the purpose of each. The constant temperature in the water baths yielding stable readings, the unvarying volume of KOH from vial to vial leading to equal amounts of carbon dioxide consumption, identical equilibration periods for all the respirometers, precise time intervals between measurements, and glass beads acting as a control for barometric pressure all served as controls.


Describe and explain the relationship between the amount of oxygen consumed and time. There was a constant, gradual incline in the amount of oxygen consumed over precise passage of time.


Condition


Calculations


Rate in mL O2/ minute


Germinating Peas/ 10 oC


(1.40-1.38)

20 min.

.001
 

Germinating Peas/ 20 oC


(1.35-.57)

20 min.

.040
 

Dry Peas/ 10 oC


(1.40-1.38)

20 min.

.001
 

Dry Peas/ 20 oC

(1.47-1.42)

20 min.

.003


Why is it necessary to correct the readings from the peas with the readings from the beads? The beads served as a control variable, therefore, the beads experienced no change in gas volume.


Explain the effects of germination (versus non-germination) on pea seed respiration. The germinating seeds have a higher metabolic rate and needed more oxygen for growth and survival. The non-germinating peas, though alive, needed to consume far less oxygen for continued subsistence.

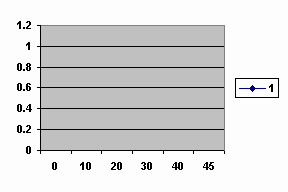
Above is a sample graph of possible data obtained for oxygen consumption by germinating peas up to about 8 oC. Draw in predicted results through 45 oC. Explain your prediction. Once the temperature reached a certain point, the enzymes necessary for cellular respiration denatured and germination (and large amounts of oxygen consumption) was inhibited.


What is the purpose of KOH in this experiment? The KOH drops absorbed the carbon dioxide and caused it to precipitate at the bottom of the vial and no longer able to effect the readings.


Why did the vial have to be completely sealed under the stopper? The stopper at the top of the vial had to be completely sealed so that no gas could leak out of the vial and no water would be allowed into the vial.


If you used the same experimental design to compare the rates of respiration of a 35g mammal at 10 oC, what results would you expect? Explain your reasoning. Respiration would be higher in the mammal since they are warm-blooded and endothermic.


If respiration in a small mammal were studied at both room temperature (21 oC) and 10 oC, what results would you predict? Explain your reasoning. Respiration would be higher at 21 degrees because it would be necessary for the animal to maintain a higher body temperature. The results would proliferate at 10 degrees because the mammal would be required to retain its body temperature at an even lower temperature in comparison to room temperature.


Explain why water moved into the respirometer pipettes. While the peas underwent cellular respiration, they consumed oxygen and released carbon dioxide, which reacted with the KOH in the vial, resulting in a decrease of gas in the pipette. The water moved into the pipette because the vial and pipette were completely submerged into the bath.


Design an experiment to examine the rates of cellular respiration in peas that have been germinating for 0, 24, 48, and 72 hours. What results would you expect? Why? Respirometers could be set up with respirometer 1 containing non-germinating peas, respirometer 2 holding peas that have been germinating 24 hours, 3 would contain the peas that germinated 48 hours, and 4 would hold the peas that germinated 72 hours. All the respirometers should have the KOH added to the bottom in the same manner as in lab described earlier. The respirometers should be placed in baths with the same temperature for all the respirometers. The seeds that have not begun germination would consume very little oxygen. The peas that have been germinating for 72 hours will have the greatest amount of oxygen consumption, while the other two samples will consume a medium (in comparison to respirometers 1 and 4 results) amount of oxygen.


Error Analysis:


Numerous errors could have occurred throughout the lab. The temperature of the baths may have been allowed to fluctuate, the amounts of peas, beads, KOH, and cotton may have varied from vial to vial damaging the results, and these problems would have occurred only during set up. Air may have been allowed to creep into the vial via a leaky stopper or poorly sealed pipette. Timing for the equilibration of the respirometers and the five-minute time intervals may have been erroneous. It was somewhat difficult to read the markings on the pipettes and so errors are always likely. Mathematical inaccuracies may have taken place when filling out the table and finding the corrected difference by using the formula provided.


Discussion and Conclusion:


The lab and the results gained from this lab demonstrated many important things relating to cellular respiration. It showed that the rates of cellular respiration are greater in germinating peas than in non-germinating peas. It also showed that temperature and respiration rates are directly proportional; as temperature increases, respiration rates increase as well. Because of this fact, the peas contained by the respirometers placed in the water at 10 oC carried on cellular respiration at a lower rate than the peas in respirometers placed in the room temperature water. The non-germinating peas consumed far less oxygen than the germinating peas. This is because, though germinating and non-germinating peas are both alive, germinating peas require a larger amount of oxygen to be consumed so that the seed will continue to grow and survive.

In the lab, CO2 made during cellular respiration was removed by the potassium hydroxide (KOH) and created potassium carbonate (K2CO3). It was necessary that the carbon dioxide be removed so that the change in the volume of gas in the respirometer was directly proportional to the amount of oxygen that was consumed. In the experiment water will moved toward the region of lower pressure. During respiration, oxygen will be consumed and its volume will be reduced to a solid. The result was a decrease in gas volume within the tube, and a related decrease in pressure in the tube. The respirometer with just the glass beads served as a control, allowing changes in volume due to changes in atmospheric pressure and/or temperature.

BACK