Category: Curriculum Map
06_32aTightJunctions_A
02_12CovalentBonds_A
06_32bDesmosomes_A
Vertebrate Notes
Vertebrate Chordates
Animals with a Backbone

All Materials © Cmassengale
The vertebrates comprise a large group of chordates, and are subdivided into seven classes (3 classes of fish, amphibians, reptiles, birds, and mammals). Vertebrates have an internal skeleton of cartilage or bone, with vertebrae surrounding the dorsal nerve cord.
Subphylum Vertebrata 
The subphylum Vertebrata consists of about 43,700 species of animals with backbones. Vertebrates exhibit all three of the chordate characteristics at some point during their lives. The embryonic notochord is replaced by a vertebral column in the adult. The vertebral column is made of individual hard segments (vertebrae) surrounding the dorsal hollow nerve cord. The nerve cord is the one chordate feature present in the adult phase of all vertebrates. The vertebral column, part of a flexible but strong endoskeleton, is evidence that vertebrates are segmented. The vertebrate skeleton is living tissue (either cartilage or bone) that grows as the animal grows.
The endoskeleton and muscles form an organ system that permits rapid and efficient movement. The pectoral and pelvic fins of fishes evolved into jointed appendages that allowed vertebrates to move onto land. The skull, the most anterior component of the main axis of the vertebrate endoskeleton, encases the brain. The high degree of cephalization in vertebrates is accompanied by complex sense organs concentrated in the head region. Eyes developed as outgrowths of the brain. Ears were equilibrium devices in aquatic vertebrates that function as sound-wave receivers in land vertebrates. Vertebrates have a complete digestive system and a large coelom. Their circulatory system is closed, with respiratory pigments contained within blood vessels. Gas exchange is efficiently accomplished by gills, lungs, and in a few cases, moist skin. Kidneys are efficient in excretion of nitrogenous waste and regulation of water. Reproduction is usually sexual with separate sexes.
Classification of the Vertebrata 
The first vertebrates were fishlike. Fishes are aquatic, gill-breathing vertebrates that usually have fins and skin covered with scales. The larval form of a modern-day lamprey, which looks like a lancelet, may resemble the first vertebrates: it has the three chordate characteristics (like the tunicate larva), as well as a two-chambered heart, a three-part brain, and other internal organs that are like those of vertebrates.
Small, jawless, and finless ostracoderms were the earliest vertebrates. They were filter feeders, but probably were also able to move water through their gills by muscular action. Ostracoderms have been found as fossils from the Cambrian through Devonian periods, when the group finally went extinct. Although extant jawless fishes lack protection, many early jawless fishes had large defensive head shields.
Class Lampreys
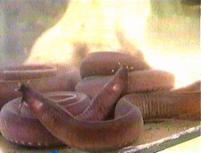
These long, eel-like, jawless fish are free-swimming predators on other fish. Lampreys hatch in freshwater and many live their lives entirely in freshwater. Some lampreys migrate to the sea, but must return to freshwater to reproduce. Lampreys have a sucker-like mouth that lacks a jaw.
 Lampreys |
 Sea lamprey on lake trout |

Sea lamprey mouth
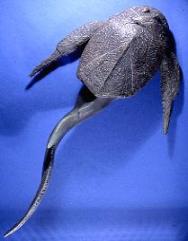
Class Myrini, Hagfish
Members of the class Myxini have a partial cranium (skull), but no vertebrae. Their skeleton is made of of cartilage, as is that of sharks. Hagfish lack jaws, and for this reason used to be classified with the lampreys in a group called the Agnatha (“no jaws”) or the Cyclostomata (“round mouth”).
Hagfish
Fish: Vertebrates With Jaws 
The fish first appeared during the Cambrian Period. Whether fish first evolved in fresh or salt water is unclear from the fossil record. The jawless fish are the most primitive group, although they were a very important group during the Silurian and Devonian periods. Hagfish and lampreys are the only living members of this class today. They have long, cylindrical bodies with cartilage skeletons and no paired fins.
The first jawed fish were the Placoderms, an extinct group of Devonian-aged jawed fishes. Placoderms were armored with heavy plates and had strong jaws and paired pectoral and pelvic fins. Paired fins allow fish to balance and to maneuver well in water, which facilitate both predation and escape.
 |
 |
The fossil is a cast of the placoderm, Bothriolepis
.
The evolution of jaws is an example of evolutionary modification of existing structures to perform new functions. Jaws are modified gill arches, and allowed the exploitation of new roles in the habitats: predators with powerful jaws. There are two classes of jawed fish: the cartilaginous fish and the bony fish.
 |
 |

Steps in the evolution of jaws by modification of gill arches.
Class Chondrichthyes: Cartilaginous Fish ![]()
The class Chondrichthyes contains approximately 850 species of skates, rays, and sharks. They have jaws, lots of teeth, paired fins, and a cartilage endoskeleton. Cartilaginous fish first appeared during the Devonian Period and expanded in diversity during the Carboniferous and Permian before nearly disappearing during the great extinction that occurred near the end of the Permian. A large group of cartilagenous fish still survives today and is an important part of the marine fauna.
These fish have five to seven gill slits on both sides of the pharynx, and lack the gill covers found in bony fish. The chondrichthyian body is covered epidermal placoid (or toothlike) scales. Developmental studies show the teeth of sharks are enlarged scales.
The largest sharks are filter feeders, not the predators of Hollywood movies. Basking and whale sharks eat tons of crustaceans (small krills, etc.) filtered from the water. Most sharks are fast-swimming, open-sea predators. The great white shark feeds on dolphins, sea lions and seals (and people sometimes). In other words, anything is WANTS to!
 |
 |
Shark and Ray
Rays and skates live on the ocean floor; their pectoral fins are enlarged into winglike fins; they swim slowly. Stingrays have a venomous spine. The electric ray family can feed on fish that have been stunned with electric shock of over 300 volts. Sawfish rays have a large anterior “saw” that they use to slash through schools of fish.
Class Osteichthyes, the Bony Fish
There are about 20,000 species of bony fish, found both in marine and freshwater, comprising the class Osteichthyes. This class is divided into two groups: the lobe-finned (Sarcopterygii) and ray-finned fish (Actinopterygii). The bony fish have a bony skeleton. Most species in this class are ray-finned with thin, bony rays supporting the fins. A few fishes are lobe-finned and are thought to be related to the ancestors of amphibians.
Cross section of a fish
Ray-finned Fish (Actinopterygii)
The ray-finned fish include familiar species such as tuna, bass, perch, and trout. Ray-finned fish are the most successful and diverse of the vertebrates (more than half of all vertebrate species belong to this group). Thin, bony supports with radiating bones (hence the term ray-finned) hold the fins away from the body. Ray-finned fish obtain their food by filter feeding and by preying on insects and other animals. Their skin is covered by scales formed of bone. These scales are homologous to our own hair (and the feathers of birds), being derived from the same embryonic tissues. The gills in this group of fish do not open separately and are covered by an operculum. Ray-finned fish have a swim bladder, a gas-filled sac, that regulates buoyancy and depth. Sharks lack this feature, which enables fish to “sleep” without sinking. The swim bladder acts much the way a ballast tank does on a submarine to control buoyancy.
Salmon, trout, and eels can migrate from fresh water to salt water, but must adjust kidney and gill function to the tonicity of their environments. In freshwater, the fish is hypotonic relative to its aqueous (watery) environment. Water is constantly flooding into the fish, and must be removed by the fish’s excretory system. In seawater, the fish is now hypertonic or isotonic relative to the seawater, requiring conservation of body water.
Bony fishes depend on color vision to detect both rivals and mates. Sperm and eggs are released into the water, with not much parental care for the newborn. Most fish have fertilization and embryonic development taking place outside the female’s body.
Lobe-finned Fish (Sarcopterygii)
This group includes six species of lungfishes and one species of coelacanth that has muscular fins with large, jointed bones attaching the fins to the body. Lobe-finned fish have fleshy fins supported by central bones, homologous to the bones in your arms and legs. These fins underwent modification, becoming the limbs of amphibians and their evolutionary descendants such as lizards, canaries, dinosaurs, and humans.
The lungfish are a small group found mostly in freshwater stagnant water or ponds that dry up in Africa, South America, and Australia.

Australian lungfish
Coelacanths live in deep oceans. They were once considered extinct, although more than 200 have been captured since 1938. Mitochondrial DNA analysis supports the hypothesis that lungfish are probably the closest living relatives of amphibians.

Coelacanth, a living fossil.
The crossopterygian fish (represented by the marine extant deep-living coelacanth and extinct freshwater forms) are regarded as ancestors of early amphibians. Extinct crossopterygians had strong fins, lungs, and a streamlined body capable of swimming as well as traveling short distances out of water.

Comparison of the skeletons of a crossopterygian lobe-finned fish and an early amphibian.
The “Tetrapods” 
The term “tetrapod” (meaning four-limbed or four-footed) has historically been applied to the land vertebrates (amphibians, reptiles, dinosaurs, birds, and mammals). All other animals from this point have four limbs and are called tetrapods.
Most zoologists would accept that the Devonian lobe-finned fishes were ancestral to the amphibians. Animals (both vertebrate as well as many invertebrates such as insects) that live on land use limbs to support the body, especially since air is less buoyant than water. Lobe-finned fishes and early amphibians also had lungs and internal nares to respire air.
Two hypotheses have been proposed to explain the evolution of amphibians from lobe-finned fishes.
- Lobe-finned fishes capable of moving from pond-to-pond had an advantage over those that could not.
- The supply of food on land, and the absence of predators, promoted adaptation to land.
The first amphibians diversified during Carboniferous Period (commonly known as the Age of Amphibians).
Class Amphibia: Animals Move Ashore 
This class includes 4000 species of animals that spend their larval/juvenile stages in water, and their adult life on land. Amphibians must return to water to mate and lay eggs. Most adults have moist skin that functions in helping their small, inefficient lungs with gas exchange. Frogs, toads, newts, salamanders, and mud puppies are in this transitional group between water and land.
Amphibian features not seen in bony fish include:
- Limbs with girdles of bone that are adapted for walking on land.
- A tongue that can be used for catching prey as well as sensory input.
- Eyelids that help keep the eyes moist.
- Ears adapted for detecting sound waves moving through the thin (as compared to water) medium of the air.
- A larynx adapted for vocalization.
- A larger brain than that of fish, and a more developed cerebral cortex.
- Skin that is thin, smooth, non-scaly, and contains numerous mucous glands; the skin plays an active role in osmotic balance and respiration.
- Development of a lung that is permanently used for gas exchange in the adult form, although some amphibians supplement lung function by exchange of gases across a porous (moist) skin.
- A closed double-loop circulatory system that replaces the single-loop circulatory path of fish.
- Development of a three-chambered heart that pumps mixed blood before and after it has gone to the lungs.
Reproduction involves a return to the water. Ther term “amphibian” refers to two life styles, one in water, the other on land. Amphibians shed eggs into the water where external fertilization occurs, as it does in fish. Generally, amphibian eggs are protected by a coat of jelly but not by a shell. The young hatch into aquatic larvae with gills (tadpoles). Aquatic larvae usually undergo metamorphosis to develop into a terrestrial adult.
Amphibians, like fish, are ectothermic; they depend upon external heat to regulate body temperatures. If the environmental temperature becomes too low, ectotherms become inactive.
Salamanders more likely resemble earliest amphibians due to their S-shaped movements. Salamanders practice internal fertilization; males produce a spermatophore that females pick up. Frogs and toads are tailless as adults, with their hind limbs specialized for jumping.
 |
 |
Frogs
Class Reptilia: Reproducton Without Water
This class of 6000 species includes the snakes, lizards, turtles, alligators, and crocodiles. Reptiles that lay eggs lay an egg surrounded by a thick protective shell and a series of internal membranes. Reptiles have internal fertilization: their gametes do not need to be released into water for fertilization to occur.
The amniotic egg is a superb adaptation to life on land. While amphibians need to lay their eggs in water, their descendants (reptiles) were not as strongly tied to moist environments and could truly expand into more arid areas. Reptiles were the first land vertebrates to practice internal fertilization through copulation and to lay eggs that are protected by a leathery shell with food and other support for the growing embryo.
The amniote egg contains extra-embryonic membranes that are not part of the embryo and are disposed of after the embryo has developed and hatched. These membranes protect the embryo, remove nitrogenous wastes, and provide the embryo with oxygen, food, and water. The amnion, one of these extra-embryonic membranes, creates a sac that fills with fluid and provides a watery environment in which the embryo develops. The embryo develops in a “pond within the shell”.
Structure of the amniote egg
Evolutionary History of Reptiles 
Reptiles first evolved during the Carboniferous time and partly displaced amphibians in many environments. The first reptiles (often referred to as the stem reptiles) gave rise to several other lineages, each of which adapted to a different way of life. Reptilian success was due to their terrestrial (amniotic) egg and internal fertilization, as well as their tough leathery skin, more efficient teeth and jaws, and in some, bipedalism (traveling on their hind legs, allowing the forelimbs to grasp prey or food, or become wings). One group, the Pelycosaurs (fin-backed or sail lizards) are related to therapsids, mammal-like reptiles ancestral to mammals. Other groups returned to aquatic environments. Ichthyosaurs were fishlike (or dolphin-like) free-swimming predators of the Mesozoic seas. The plesiosaurs had a long neck and a body adapted tp swimming though use of flippers (legs that evolutionarily reverted to a flipper-like shape). These free-swimmers also adapted to live birth of their young (since they could not return to the land to lay eggs). Thecodonts were the reptiles that gave rise to most of the reptiles, living and extinct. Pterosaurs were flying reptiles that dominated the Mesozoic skies. They had a keel for attachment of flight muscles and air spaces in bones to reduce weight.
Dinosaurs (descended from some thecodonts) and mammal-like reptiles’ had their limbs beneath the body providing increased agility and facilitating gigantic size. Lizards have their elbows out (like you do when you do a push-up). By having their elbows in, dinosaurs and mammals place more of the weight of the body on the long bones instead of the elbows, ankles, and knees.
Relationship between limbs and body. Note that reptiles have their upper limbs jutting out from the body, while mammals have their limbs in line with the body, supporting and more easily raising the body mass off the ground.
Reptiles dominated the earth for about 170 million years during the Mesozoic Era. The mass extinction of many reptile groups at the close of the Mesozoic (the Cretaceous Period) has been well documented and the subject of many hypotheses. The 1980 hypothesis by Luis and Walter Alvarez and others proposes the impact of a large meteorite at the end of the Cretaceous period caused a catastrophic environmental collapse that led to the extinction of nearly 50% of all species of life on Earth. The survivors, birds and mammals, reaped the spoils and diversified during the Cenozoic Era. Three groups of reptiles remain: turtles, snakes/lizards, and crocodiles/alligators.
About 6,000 species of reptiles comprise the Class Reptilia. Most live in tropics or subtropics. Lizards and snakes live on land, while turtles and alligators live in water for much of their lives. Reptiles have a thick, scaly skin that is keratinized and impermeable to water. This same keratin is a protein found in hair, fingernails, and feathers. Protective skin prevents water loss but requires several molts a year. Reptilian lungs are more developed than those of amphibians. Air moves in and out of the lungs due to the presence of an expandable rib cage in all reptiles except turtles. Most reptiles have a nearly four-chambered heart. The crocodile has a completely four-chambered heart that more fully separates oxygen-rich blood from from deoxygenated or oxygen-poor blood. The well-developed kidneys excrete uric acid; less water is lost in excretion. Reptiles are ectothermic; they require a fraction of the food per body weight of birds and mammals, but are behaviorally adapted to warm their body temperature by sunbathing.
 |
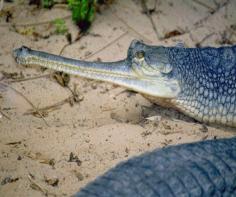 |
Photograph of a lizard (L) and a gavial (R)
Snakes and lizards live mainly in the tropics and desert. Lizards have four clawed legs and are carnivorous; marine iguanas on the Galapagos are adapted to spend time in the sea; frilled lizards have a collar to scare predators, and blind worm lizards live underground. Snakes evolved from lizards and lost their legs as an adaptation to burrowing. Their jaws can readily dislocate to engulf large food. The snake’s tongue collects airborne molecules and transfers them to the Jacobson’s organ for tasting. Some poisonous snakes have special fangs for injecting their venom.
Turtles have a heavy shell fused to the ribs and thoracic vertebrae; they lack teeth but use a sharp beak; sea turtles must leave the ocean to lay eggs onshore.
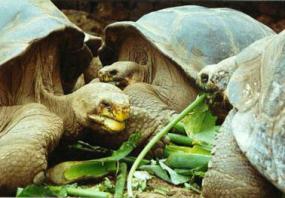
Galapagos tortoises
Crocodiles and alligators are largely aquatic, feeding on fishes and other animals. They both have a muscular tail that acts as a paddle to swim and a weapon. The male crocodile bellows to attract mates. In some species the male also protects the eggs and young.
The Archosauria: Birds, Dinosaurs, and More
Cladistic analyses place the birds, alligators, and dinosaurs in the same clade, the Archosauria (or “ruling reptiles”). This group is a major group of diapsids (vertebrates that have two openings in their skulls) that have single openings in each side of the skull, in front of the eyes (antorbital fenestrae), among other characteristics. This helps to lighten the skull, provides more room for muscles and other tissues, and allows more skull flexibility when eating. Other typical archosaurian characteristics include another opening in the lower jaw (the mandibular fenestra), a high narrow skull with a pointed snout, teeth set in sockets, and a modified ankle joint.
The ancestral archosaurs probably originated some 250 million years or so ago, during the late Permian period. Their descendants (such as the dinosaurs) dominated the realm of the terrestrial vertebrates for a most of the Mesozoic Era. The birds and crocodilians are the last living groups of archosaurs.
Class Aves: Birds of a Feather
The class Aves (birds) contains about 9000 species. Birds evolved from either a dinosaurian or other reptilian group during the Jurassic (or possibly earlier). The earliest bird fossils, such as the Jurassic Archaeopteryx or Triassic Protavis, display a mosaic of reptilian and bird features (teeth in the bill, a jointed tail, and claws on the wing are reptilian; feathers and hollow bones are bird-like).

Archaeopteryx, once considered the first bird.The fossil is from the Solenhoefen Limestone (Jurassic) of Germany
The distinguishing feature of birds is feathers: which provide insulation as well as aid in flight.
 Structure of a feather |
 Hummingbird Feather |
Remember, not all animals that fly have feathers, but all almost every endothermic animal (warm-blooded) has a covering of hair or feathers for insulation. The recent (1999) discovery of a “feathered” dinosaur adds credence to this speculation. The dinosaur could not fly, so of what use would feather be but insulation (or possibly mating).
Modern birds appeared during the early Tertiary, and have adapted to all modes of life: flying (condors, eagles, hummingbirds), flightless-running (ostriches, emus), and swimming (penguins). Birds exhibit complex mating rituals as well as social structure (a pecking order!).
 Mallard Hen |
 Bald Eagle |
Class Mammalia: Got Milk?
Class Mammalia contains around 5000 species placed in 26 orders (usually). The three unifying mammalian characteristics are:
- hair
- the presence of three middle ear bones
- the production of milk by mammary glands
Milk is a substance rich in fats and proteins. Mammary glands usually occur on the ventral surface of females in rows (when there are more than two glands). Humans and apes have two mammary glands (one right, one left), while other animals can have a dozen or more. All mammals have hair at some point during their life. Mammalian hair is composed of the protein keratin. Hair has several functions: 1) insulation; 2) sensory function (whiskers of a cat); 3) camouflage, a warning system to predators, communication of social information, gender, or threats; and 4) protection as an additional layer or by forming dangerous spines that deter predators. Modifications of the malleus and incus (bones from the jaw in reptiles) work with the stapes to allow mammals to hear sounds after they are transmitted from the outside world to their inner ears by a chain of these three bones.
Mammals first evolved from the mammal-like reptiles during the Triassic period, about the same time as the first dinosaurs. However, mammals were minor players in the world of the Mesozoic, and only diversified and became prominent after the extinction of dinosaurs at the close of the Cretaceous period.
Mammals have since occupied all roles once held by dinosaurs and their relatives (flying: bats; swimming: whales, dolphins; large predators: tigers, lions; large herbivores: elephants, rhinos), as well as a new one (thinkers and tool makers: humans). There are 4500 species of living mammals.
Mammalian Adaptations
- Mammals developed several adaptations that help explain their success.
- Teeth are specialized for cutting, shearing or grinding; thick enamel helps prevent teeth from wearing out.
- Mammals are capable of rapid locomotion.
- Brain sizes are larger per pound of body weight than most other animals’.
- Mammals have more efficient control over their body temperatures than do birds.
- Hair provides insulation.
- Mammary glands provide milk to nourish the young.
Mammalian Classification
Subclass Prototheria: Order Monotremata: Monotremes (typified by the platypus and echinda) lay eggs that have similar membranes and structure to reptilian eggs. Females burrow in ground and incubates their eggs. Both males and females produce milk to nourish the young There are two families living today and quite a few known from the fossil record of Gondwana. Monotremes are today restricted to Australia and New Guinea. The earliest fossil monotreme is from the early Cretaceous, and younger fossils hint at a formerly more widespread distribution for the group. While their fossil record is scarce, zoologists believe that monotremes probably diverged from other mammals during the Mesozoic. Monotremes have many differences with other mammals and are often placed in a separate group, the subclass Prototheria. They retain many characters of their therapsid ancestors, such as laying eggs, limbs oriented with humerus and femur held lateral to body (more lizard-like), a cloaca, skulls with an almost birdlike appearance, and a lack of teeth in adults. This suggests that monotremes are the sister group to all other mammals. However, monotremes do have all of the mammalian defining features of the group.
 Platypus |
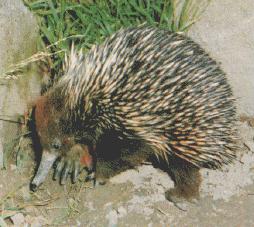 Echidna |
Subclass Metatheria: Marsupials (such as the koala, opossum, and kangaroo) are born while in an embryonic stage and finish development outside the mother’s body, often in a pouch. Marsupial young leave the uterus, crawl to the pouch, and attach to the nipple of a mammary gland and continue their development. Marsupials were once widespread, but today are dominant only in Australia, where they underwent adaptive radiation in the absence of placental mammals. The Metatheria contains 272 species classified in several orders. Metatheres diverged from the lineage leading to the eutherian (placental) mammals by the middle of the Cretaceous period in North America. The earliest marsupial fossils resemble North American opossums. Marsupial fossils are found on other northern hemisphere continents, although they seem not to have been prominent elements of those faunas. On the other hand, in South America and Australia, marsupials continued to be dominant faunal elements. The marsupials of South America began to go extinct in the late Miocene and Early Pliocene (Cenozoic era) when volcanic islands grew together and formed the Isthmus of Panama, allowing North American placental mammals to cross into South America. Australian marsupials remain diverse and dominant native mammals of the fauna. During the Cenozoic Era many marsupials in South America and Australia underwent parallel (or convergent) evolution with placental mammals elsewhere, producing marsupial “wolves”, “lions”, and saber-toothed marsupial “cats”.
Red Kangaroo with its joey
 Koala |
 Tasmanian Devil |
Subclass Eutheria: There are 4000 described species of placental mammals, a group that includes dogs, cats, and people. The subclass is defined by a true placenta that nourishes and protects the embryos held within the mother’s body for an extended gestation period (nearly two years for an elephant, and nine very long months for a human). The eutherian placenta has extraembryonic membranes modified for internal development within the uterus. The chorion is the fetal portion of placenta, while the uterine wall grows the maternal portion. The placenta exchanges nutrients, oxygen, and wastes between fetal and maternal blood.
There are 12 orders of placental mammals. Classification is based on the mode of locomotion and methods of obtaining food. Prominent orders include the bats (order Chiroptera), horses (order Perissodactyla), whales (order Cetacea), mice (order Rodentia), dogs (order Carnivora), and monkeys/apes/humans (order Primates).
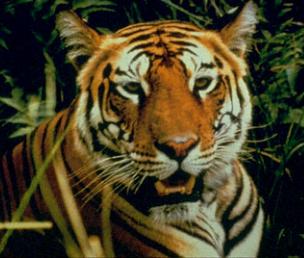 Bengal Tiger |
 Drill |