Water Properties Handout

Physical Properties of Water

All of water’s unique physical properties are caused by water’s polarity.

  1. Cohesion: water molecules stick to each other.  This is caused by hydrogen bonds that form between the slightly positive and negative ends of neighboring molecules.  This is the reason why water is found in drops; perfect spheres.  It’s hard to imagine water behaving any other way.

  1. Adhesion: water molecules stick to other surfaces.  This causes water to move upward against gravity in plant stems and to be absorbed by paper towels.  It also causes water to adhere to spider webs.

  1.   Surface Tension: water has the ability to support small objects.  The hydrogen bonds between neighboring molecules cause a “film” to develop at the surface.


Organisms like the water strider can be seen taking advantage of this property.


4.  Water has a high boiling point.  Water is one of the few substances that remain a liquid at such a large range of temperatures (O-100 °C).  A large amount of energy must be invested to overcome the hydrogen bonds in liquid water to change it to the gas phase.


Liquid Water Molecules with hydrogen bonds                              Water Vapor Molecules

5.  Capillary Action: water has the ability to “climb” structures.  Think about what happens when you stick the tip of a straw in a glass of water.

6.  Ability to Dissolve: water is consider to be the universal solvent.  More substances will dissolve in water than any other liquid.  This includes other polar substances (such as sugar) and ionic compounds (such as salt).


When a sugar crystal is placed in water, the slightly positive and negative ends of the water molecule attract the sugar molecules in the crystal (they are also polar) and pull them into solution.


When an salt crystals are placed in water, the slightly positive and negative ends of the water molecules attract the ions in the crystal.  The ionic bonds holding the sodium and chlorine ions together are broken and the ions are pulled into solution.


7. High Heat of Vaporization:

Water Properties


Water Properties
States of Water
Adhesion and Cohesion
Surface Tension
Capillary Action

The States of Water

Water has three states. Below freezing water is a solid (ice or snowflakes), between freezing and boiling water is a liquid, and above its boiling point water is a gas. There are words scientists use to describe water changing from one state to another. Water changing from solid to liquid is said to be melting. When it changes from liquid to gas it is evaporating. Water changing from gas to liquid is called condensation (An example is the ‘dew’ that forms on the outside of a glass of cold soda). Frost formation is when water changes from gas directly to solid form. When water changes directly from solid to gas the process is called sublimation.

Gas
Liquid
Solid

Most liquids contract (get smaller) when they get colder. Water is different. Water contracts until it reaches 4 C then it expands until it is solid. Solid water is less dense that liquid water because of this. If water worked like other liquids, then there would be no such thing as an ice berg, the ice in your soft drink would sink to the bottom of the glass, and ponds would freeze from the bottom up!

Water is found on Earth in all three forms. This is because Earth is a very special planet with just the right range of temperatures and air pressures.

Adhesion and Cohesion

Water is attracted to other water. This is called cohesion. Water can also be attracted to other materials. This is called adhesion.

The oxygen end of water has a negative charge and the hydrogen end has a positive charge. The hydrogens of one water molecule are attracted to the oxygen from other water molecules. This attractive force is what gives water its cohesive and adhesive properties.

Surface Tension

Surface tension is the name we give to the cohesion of water molecules at the surface of a body of water. Try this at home: place a drop of water onto a piece of wax paper. Look closely at the drop. What shape is it? Why do you think it is this shape?

What is happening? Water is not attracted to wax paper (there is no adhesion between the drop and the wax paper). Each molecule in the water drop is attracted to the other water molecules in the drop. This causes the water to pull itself into a shape with the smallest amount of surface area, a bead (sphere). All the water molecules on the surface of the bead are ‘holding’ each other together or creating surface tension.

Surface tension allows water striders to ‘skate’ across the top of a pond. You can experiment with surface tension. Try floating a pin or a paperclip on the top if a glass of water. A metal pin or paper clip is heavier than water, but because of the surface tension the water is able to hold up the metal.

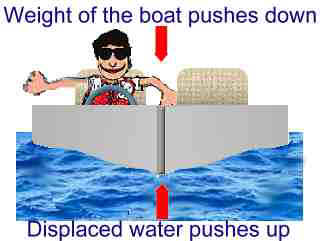
Surface tension is not the force that keeps boats floating. If you want to know why a boat floats look here: Why do boats float?

stability1.jpg (8249 bytes)
The key to floating is that the object must displace an amount of water which is equal to its own weight.

Capillary Action

Surface tension is related to the cohesive properties of water. Capillary action however, is related to the adhesive properties of water. You can see capillary action ‘in action’ by placing a straw into a glass of water. The water ‘climbs’ up the straw. What is happening is that the water molecules are attracted to the straw molecules. When one water molecule moves closer to a the straw molecules the other water molecules (which are cohesively attracted to that water molecule) also move up into the straw. Capillary action is limited by gravity and the size of the straw. The thinner the straw or tube the higher up capillary action will pull the water (Can you make up an experiment to test this?).

Plants take advantage of capillary action to pull water from the into themselves. From the roots water is drawn through the plant by another force, transpiration.

Wiseowl Archive


2008-09
 Chase – AP Biology Ivy – PreAP Biology Hoda – PreAP Biology
Rachael – AP Biology Taylor – Biology I Jacob – PreAP Biology
Koreena – Pre AP Biology Zach – Pre AP Biology Gracen – Pre AP Biology
Amanda – Pre AP Biology Shelby – Pre AP Biology Ashley – AP Biology
Valorie – Biology I Katie – Pre AP Biology Regan – AP Biology
Gabrielle – Biology I John – Pre AP Biology Are You the next Wise Owl?


2007-08
Michael – AP Biology Elizabeth – AP Biology Laura – PreAP Biology
Rachael – Pre AP Biology Ashley – Pre AP Nolan – AP Biology
Julia – Pre AP Biology Josh – Biology I Samantha – Pre AP Biology
Steven – AP Biology Alex – AP Biology Lydia – AP Biology
Amber – AP Biology Are You the next Wise Owl?
2006-07
Chase Charlene Blake
Elizabeth Michael Nolan
Harrison Sijia
Lauren Amber
Steven Joseph Megan
Nenteza Lauren Are You the next Wise Owl?


Water Movement in Celery Stems


Water Transport in Plant Stems

INTRODUCTION:

As water evaporates from the leaves of a plant, more water is drawn up by osmosis from the tissues below to replace it. The replacement of water lost through transpiration is possible because water molecules have polar covalent bonds. This causes one end of the molecule to have a slightly positive charge and the other end to have a negative charge. Because of this, the water molecules act like “small magnets”. The positive end of one water molecule sticks to the negative end of another in a long chain that is pulled upward against the force of gravity.
When enclosed in a narrow tube, such as the transport vessels of a plant, water molecules can withstand a large force without being pulled apart.

MATERIALS NEEDED:

Celery stalk with leaves intact Metric ruler
400-mL beaker Distilled water
Glass bowl Red food coloring
Razor blade Stirring rod

PROCEDURE:

1. Fill the beaker with 100 mL of distilled water. Add drops of red food coloring, stirring with the stirring rod, until the water is a dark red color. Set this aside.

2. Put some distilled water in the glass bowl. While holding the bottom end of the celery stalk under water, cut off the bottom two centimeters of the celery stalk.

3. Quickly place the freshly cut celery stalk upright in the beaker of colored water. Record the beginning time on your DATA TABLE

4. Allow the celery to remain in the food coloring until the color is visible in the upper stem and leaves. Record the ending time on your DATA TABLE, and remove from the beaker of food coloring.

5. Measure the length the red color traveled up the celery stalk in centimeters. Record on your DATA TABLE

DATA TABLE:

Beginning time: ___________

Ending time: ___________

Length food color traveled up stalk. ______ cm

CALCULATIONS:

6. Calculate the number of minutes it took for the coloring to reach the top.

Time for color to reach the top of stalk. = _________ minutes

7. Calculate the rate of travel of the food coloring up the celery stalk in centimeters per minute.


Rate of Travel = length of celery stalk (cm)
time for color to reach top of stalk (min)


Rate of travel = _________ cm / min

QUESTIONS:

1. What type of tissue moves water upward in a plant stem?


2. Name and explain 2 properties of water that enable it to move upward against gravity in a stem.


3. What is transpiration and where does it occur in plants?


4. How does transpiration help the upward movement of water?


Scientific Method & Hand Size Lab


Using the Scientific Method


Introduction:

Humans are classified as a separate species because of all the special characteristics that they possess. These characteristics are controlled by strands of DNA located deep inside their cells. This DNA contains the code for every protein that an organism has the ability to produce. These proteins combine with other chemicals, within the body, to produce the cells, tissues, organs, organ systems, and finally the organism itself. The appearance of these organs, such as the shape of ones nose, length of the fingers, or the color of the eyes is called the phenotype.

Even though humans contain hands with five fingers, two ears, or one nose, there are subtle differences that separate these organs from another. There are subtle differences in a person’s genes that allows for these different phenotypes. In this lab, we are going to observe some of these differences in phenotype. All human hands look pretty much alike, but there are genes on your chromosomes that code for the characteristics making up your hand. We are going to examine two of these characteristics (hand width and hand length) and try to determine why these phenotypic differences occurred.

Materials:

  • metric ruler (see end of lab)
  • pencil
  • calculator

Procedures:

Day 1

  1. Choose a partner and have them measure the length of your right hand in centimeters. (Measure from the tip of your middle finger to the beginning of your wrist as shown in figure 1.)  Record your measurements in Table 1.
  2. Now measure and record the length in centimeters of your partners hand.
  3. Have your partner measure the width of your right hand, straight across the palm, and record the data in Table 1. (see figure 1.)
  4. Now measure & record the width of your partner’s hand.

Figure 1.


Table 1


Group Data on Right Hand Width and Length
Student Name Length of Hand (cm) Width of Palm (cm)


  1. After the entire class has completed Table 1, record your group data on the Class Data Table at the front of the room
  2. Record the Class Data Table information on your lab sheet’s Table 2.

Table 2

Class Data on Right hand Width and Length (cm)

Class Period:

Student Gender
(M / F)
Hand Length (cm) Hand Width (cm)
1. M / F
2. M / F
3. M / F
4. M / F
5. M / F
6. M / F
7. M / F
8. M / F
9. M / F
10. M / F
11. M / F
12. M / F
13. M / F
14. M / F
15. M / F
16. M / F
17. M / F
18. M / F
19. M / F
20. M / F
21. M / F
22. M / F
23. M / F
24. M / F

Click for Class Data Table

Day 2

  1. In order to form a more accurate conclusion, the collection of additional data is necessary. Using the Class

. The teacher has the option to include the data from all the classes running this experiment. Below find tables that will allow the tabulation of several classes of data.


Table 3: All Classes Hand Length

Measurement of Hand length in cm. # of Males # of Females Total # ( Male + Female )
1.—————— ——————– ——————- ——————
2.—————— ——————- ——————- ——————-
3.—————— ——————- ——————- ——————-
4.—————— ——————- ——————- ——————-
5.—————— ——————- ——————- ——————-
6.—————— ——————- ——————- ——————-
7.—————— ——————- ——————- ——————-
8.—————— ——————- ——————- ——————-
9.—————— ——————- ——————- ——————-


Table 4: All Classes Hand Width

Measurement of Hand width in cm. # of Males # of Females Total # ( Male + Female )
1.—————— ——————– ——————- ——————
2.—————— ——————- ——————- ——————-
3,—————- ——————- ——————- ——————-
4.—————— ——————- ——————- ——————-
5.—————— ——————- ——————- ——————-
6.—————— ——————- ——————- ——————-
7.—————— ——————- ——————- ——————-
8.—————— ——————- ——————- ——————-
9.—————— ——————- ——————- ——————-


Line Graph the data from Tables 3 and 4. and then answer the questions that follow. Use the measurements of the width and length as your independent variable and the number of times that measurement appeared as your dependent variable.

Graph Tile: ___________________________________________________________


Analysis:

1. Examine the above graph. What is the shape of the line for hand length? _____________

________________________________________________________________________

2. What is the most abundant measurement for hand length? __________________.

3. What is (are) the least abundant measurement(s)? _________________________.

4. If we are to assign letters to represent the various lengths, what value(s) would we assign to the dominant genotype (HH)? ________________; the recessive genotype (hh)? ___________, and he heterozygous genotype (Hh)? _________________.

5. What would be the phenotypic name for the ( HH ) genotype? ___________________.

6. What would be the phenotypic name for the ( Hh ) genotype? ___________________.

7. What would be the phenotypic name for the ( hh ) genotype? ____________________.

8. Examine the above graph. What is the shape of the line for hand width ? ____________

________________________________________________________________________

9. What is the most abundant measurement for hand width? __________________.

10. What is (are) the least abundant measurement(s)? _________________________.

11. If we are to assign letters to represent the various lengths, what value(s) would we assign to the dominant genotype (WW)? ________________; the recessive genotype (ww)? ___________, and he heterozygous genotype (Ww)? _________________.

12. What would be the phenotypic name for the ( WW ) genotype? __________________.

13. What would be the phenotypic name for the ( Ww ) genotype? ___________________.

14. What would be the phenotypic name for the ( ww ) genotype? ___________________.

15. Are there any similarities in the graph of the above two characteristics? ____________.

16. If so, what are they? ____________________________________________________

17. Are there any differences in the graph of the above two characteristics? ____________.

18. If so, what are they? ____________________________________________________

19. Is there a difference in the length and width of the male and female hand? ___________.

20. Does the gender of a person have an effect on the phenotype of a trait? _____________.

Explain _________________________________________________________________

_______________________________________________________________________

________________________________________________________________________


Cut and use:

________________________________________________________________________