Photosynthesis

Photosynthesis
All Materials © Cmassengale

I. Capturing the Energy of Life

  1. All organisms require energy
  2. Some organisms (autotrophs) obtain energy directly from the sun and store it in organic compounds (glucose) during a process called photosynthesis

6CO2 + 6H2O + energy –>  6O2 + C6H12O6

II. Energy for Life Processes

  1. Energy is the ability to do work
  2. Work for a cell includes growth & repair, active transport across cell membranes, reproduction, synthesis of cellular products, etc.
  3. Work is the ability to change or move matter against other forces (W = F x D)
  4. Autotrophs or producers convert sunlight, CO2, and H2O into glucose (their food)
  5. Plants, algae, and blue-green bacteria, some prokaryotes, are producers or autotrophs
  6. Only 10% of the Earth’s 40 million species are autotrophs
  7. Other autotrophs use inorganic compounds instead of sunlight to make food; process known as chemosynthesis
  8. Producers make food for themselves and heterotrophs or consumers that cannot make food for themselves
  9. Heterotrophs include animals, fungi, & some bacteria, & protists

III.      Biochemical Pathways

  1. Photosynthesis and cellular respiration are biochemical pathways
  2. Biochemical pathways are a series of reactions where the product of one reaction is the reactant of the next
  3. Only autotrophs are capable of photosynthesis
  4. Both autotrophs & heterotrophs perform cellular respiration to release energy to do work
  5. In photosynthesis, CO2(carbon dioxide) and H2O (water) are combined to form C6H12O6 (glucose) & O2 (oxygen)
    6CO2 + 6H2O + energy –>  6O2 + C6H12O6
  6. In cellular respiration, O2 (oxygen) is used to burn C6H12O6 (glucose) & release CO2(carbon dioxide), H2O (water), and energy 
  7. Usable energy released in cellular respiration is called adenosine triphosphate or ATP


IV. Light Absorption in Chloroplasts

  1. Chloroplasts in plant & algal cells absorb light energy from the sun during the light dependent reactions
  2. Photosynthetic cells may have thousands of chloroplasts
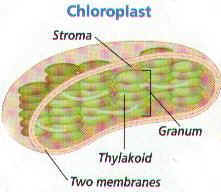
  3. Chloroplasts are double membrane organelles with the an inner membrane folded into disc-shaped sacs called thylakoids
  4. Thylakoids, containing chlorophyll and other accessory pigments, are in stacks called granum (grana, plural)
  5. Grana are connected to each other & surrounded by a gel-like material called stroma
  6. Light-capturing pigments in the grana are organized into photosystems

 V. Pigments

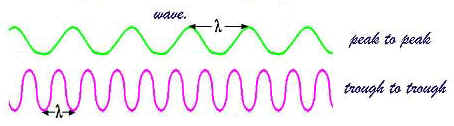
  1. Light travels as waves & packets called photons
  2. Wavelength of light is the distance between 2 consecutive peaks or troughs

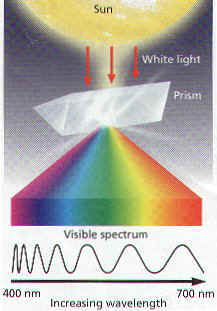
  1. Sunlight or white light is made of different wavelengths or colors carrying different amounts of energy
  2. A prism separates white light into 7 colors (red, orange, yellow, green, blue, indigo, & violet) ROY G. BIV
  3. These colors are called the visible spectrum

  1. When light strikes an object, it is absorbed, transmitted, or reflected
  2. When all colors are absorbed, the object appears black
  3. When all colors are reflected, the object appears white
  4. If only one color is reflected (green), the object appears that color (e.g. Chlorophyll)
VI. Pigments in the Chloroplasts


chlorophyll is found only in the chloroplasts
  1. Thylakoids contain a variety of pigments ( green red, orange, yellow…)
  2. Chlorophyll  (C55H70MgN4O6) is the most common pigment in plants & algae
  3. Chlorophyll a & chlorophyll b are the 2 most common types of chlorophyll in autotrophs
  4. Chlorophyll absorbs only red, blue, & violet light
  5. Chlorophyll b absorbs colors or light energy NOT absorbed by chlorophyll a
  6. The light energy absorbed by chlorophyll b is transferred to chlorophyll a in the light reactions

structural formula of chlorophyll

  1. Carotenoids are accessory pigments in the thylakoids & include yellow, orange, & red


VII. Overview of Photosynthesis        6CO2 + 6H2O C6H12O6 + 6O2

  1. Photosynthesis is not a simple one step reaction but a biochemical pathway involving many steps
  2. This complex reaction can be broken down into  two reaction systems — light dependent & light independent or dark reactions
  • Light Reaction:         H2O O2 + ATP + NADPH2
    • Water is split, giving off oxygen.
    • This system depends on sunlight for activation energy.
    • Light is absorbed by chlorophyll a which “excites” the electrons in the chlorophyll molecule.
    • Electrons are passed through a series of carriers and adenosine triphosphate or ATP (energy) is produced.
    • Takes place in the thylakoids.
  • Dark Reaction:         ATP + NADPH2 + CO2 C6H12O6
    • Carbon dioxide is split, providing carbon to make sugars.
    • The ultimate product is glucose.
    • While this system depends on the products from the light reactions, it does not directly require light energy.
    • Includes the Calvin Cycle.
    • Takes place in the stroma.

VIII. Calvin Cycle

  1. Carbon atoms from CO2 are bonded or “fixed” into organic compounds during a process called carbon fixation
  2. The energy stored in ATP and NADPH during the Light Reactions is used in the Calvin cycle
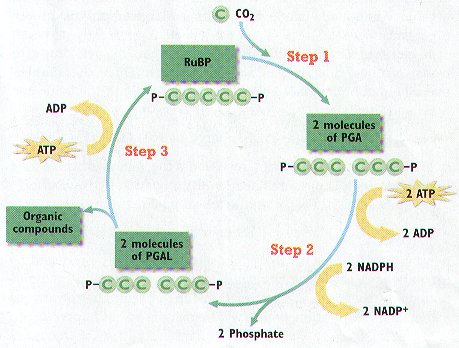
  3. The Calvin cycle has 3 main steps occurring within the stroma of the Chloroplast

     STEP 1

  • CO2 diffuses into the stroma from surrounding cytosol
  • An enzyme combines a CO2 molecule with a five-carbon carbohydrate called RuBP
  • The six-carbon molecule produced then splits immediately into a pair of three-carbon molecules known as PGA

      STEP 2

  • Each PGA molecule receives a phosphate group from a molecule of ATP
  • This compound then receives a proton from NADPH and releases a phosphate group producing PGAL
  • These reactions produce ADP, NADP+, and phosphate which are used again in the Light Reactions.

   STEP 3

  • Most PGAL is converted back to RuBP to keep the Calvin cycle going
  • Some PGAL leaves the Calvin Cycle and is used to make other organic compounds including amino acids, lipids, and carbohydrates
  • PGAL serves as the starting material for the synthesis of glucose and fructose
  • Glucose and fructose make the disaccharide sucrose, which travels in solution to other parts of the plant (e.g., fruit, roots)

movements within plants

  • Glucose is also the monomer used in the synthesis of the polysaccharides starch and cellulose

  1. Each turn of the Calvin cycle fixes One CO2 molecule so it takes six turns to make one molecule of glucose

IX. Photosystems & Electron Transport Chain

  1. Only 1 in 250 chlorophyll molecules (chlorophyll a) actually converts light energy into usable energy
  2. These molecules are called reaction-center chlorophyll
  3. The other molecules (chlorophyll b, c, & d and carotenoids) absorb light energy and deliver it to the reaction-center molecule
  4. These chlorophyll molecules are known as antenna pigments
  5. A unit of several hundred antenna pigment molecules plus a reaction center is called a photosynthetic unit or photosystem
  6. There are 2 types of photosystems — Photosystem I & Photosystem II
  7. Light is absorbed by the antenna pigments of photosystems II and I
  8. The absorbed energy is transferred to the reaction center pigment, P680 in photosystem II, P700 in photosystem I
  9. P680 in Photosystem II loses an electron and becomes positively charged so it can now split water & release electrons  (2H2O   4H+   +   4e-   +  O2)
  10. Electrons from water are transferred to the cytochrome complex of Photosystem I
  11. These excited electrons activate P700 in photosystem I which helps reduce NADP+ to NADPH
  12. NADPH is used in the Calvin cycle
  13. Electrons from Photosystem II replace the electrons that leave chlorophyll molecules in Photosystem I

X. Chemiosmosis (KEM-ee-ahz-MOH-suhs)

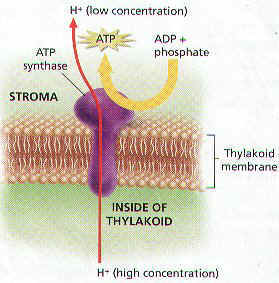
  1. Synthesis or making of ATP (energy)
  2. Depends on the concentration gradient of protons ( H+) across the thylakoid membrane
  3. Protons (H+) are produced from the splitting of water in Photosystem II
  4. Concentration of Protons is HIGHER in the thylakoid than in the stroma
  5. Enzyme, ATP synthetase in the thylakoid membrane, makes ATP by adding a phosphate group to ADP

XI. Alternate Pathways

  1. The Calvin cycle is the most common pathway used by autotrophs called C3 Plants
  2. Plants in hot, dry climates use alternate pathways to fix carbon & then transfer it to the Calvin cycle
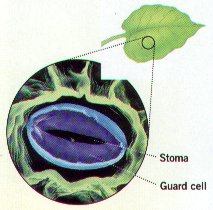
  3. Stomata are small openings on the underside of leaves for gas exchange (O2 & CO2)
  4. Guard cells on each side of the stoma help open & close the stomata
  5. Plants also lose H2O through stoma so they are closed during the hottest part of the day

  1. C4 plants  fix CO2 into 4-Carbon Compounds during the hottest part of the day when  their stomata are partially closed
  2. C4 plants include corn, sugar cane and crabgrass
  3. CAM plants include cactus & pineapples
  4. CAM plants open their stomata at night and close during the day so CO2 is fixed at night
  5. During the day, the CO2 is released from these compounds and enters the Calvin Cycle

XII. Factors Determining the Rate of Photosynthesis

  1. Light intensity – As light intensity increases, the rate of photosynthesis initially increases and then levels off to a plateau
  2. Temperature – Only the dark, not the light reactions are temperature dependent because of the enzymes they use (25 oC to 37oC)
  3. Length of day
  4. Increasing the amount of carbon dioxide available improves the photosynthesis rate
  5. Level of air pollution


BACK


Physiology of the Circulatory System


Physiology of the Circulatory System

Introduction:
The circulatory system functions to deliver oxygen an nutrients to tissues for growth and metabolism, and to remove metabolic wastes. The heart pumps blood through a circuit that includes arteries, arterioles, capillaries, venules, and veins. One important circuit is the pulmonary circuit, where there is an exchange of gases within the alveoli of the lung. The right side of the human heart receives deoxygenated blood from body tissues and pumps it to the lungs. The left side of the heart receives oxygenated blood from the lungs and pumps it to the tissues. With increased exercise, several changes occur within the circulatory system, thus increasing the delivery of oxygen to actively respiring muscles cells. These changes include increased heart rate, increased blood flow to muscular tissue, decreased blood flow to non muscular tissue, increased arterial pressure, increased body temperature and increased breathing rate.

Blood Pressure
An important measurable aspect of the circulatory system is blood pressure. When the ventricles of the heart contract, pressure is increased throughout all the arteries. Arterial blood pressure is directly dependent on the amount of blood pumped by the heart per minute and the resistance to blood flow through the arterioles. The arterial blood pressure is determined using a device known as a sphygmomanometer. This device consists of an inflatable cuff connected by rubber hoses to a hand pump and to a pressure gauge graduated in millimeters of mercury. The cuff is wrapped around the upper arm and inflated to a pressure that will shut off the brachial artery. The examiner listens for the sounds of blood flow in the brachial artery by placing the bell of a stethoscope in the inside of the elbow below the biceps.

Figure 10.1 The sphygmomanometer


At rest, the blood normally goes through the arteries so that the blood in the central part of the artery moves faster than the blood in the peripheral part. Under these conditions, the artery is silent when one listens. When the sphygmomanometer cuff is inflated to a pressure above the systolic pressure, the flow of blood is stopped and the artery is silent again. As the pressure in the cuff gradually drops to levels between the systolic and diastolic pressures of the artery, the blood is pushed through the compressed walls of the artery in a turbulent flow. Under these conditions, the blood is mixed, and the turbulence sets up vibrations in the artery that are heard as sounds in the stethoscope. These sounds are known as the heart sounds or sounds of Korotkoff. The sounds are divided into five phases based on the loudness and quality of the sounds.

  • Phase 1. A loud, clear tapping sound is evident that increases in intensity as the cuff is deflated.
  • Phase 2. A succession of murmurs can be heard. Sometimes the sounds seem to disappears during this time which may be a result of inflating or deflating the cuff too slowly.
  • Phase 3. A loud, thumping sound, similar to that in Phase 1 but less clear, replaces the murmurs.
  • Phase 4. A muffled sound abruptly replaces the thumping sounds of Phase 3.
  • Phase 5. All sounds disappear.

The cuff pressure at which the first sound is heard (that is, the beginning of Phase 1) is taken as the systolic pressure. The cuff pressure with the muffled sound(Phase 4) disappears (the beginning of Phase 5). is taken as the measurement of the diastolic pressure. A normal blood pressure measurement for a given individual depends on a person’s age, sex, heredity, and environment. When these factors are taken into account, blood pressure measurements that are chronically elevated may indicate a state deleterious to the health of the person. This condition is called hypertension and is a major contributing factor in heart disease and stroke.

Table 10.1: Normal Blood Pressure for Men and Women at Different Ages

Systolic Pressure Diastolic Pressure
Age in Years Men Women Men Women
10 103 103 69 70
11 104 104 70 71
12 106 106 71 72
13 108 108 72 73
14 110 110 73 74
15 112 112 75 76
16 118 116 73 72
17 121 116 74 72
18 120 116 74 72
19 122 115 75 71
20-24 123 116 76 72
25-29 125 117 78 74
30-34 126 120 79 75
35-39 127 124 80 78
40-44 129 127 81 80
45-49 130 131 82 82
50-54 135 137 83 84
55-59 138 139 84 84
60-64 142 144 85 85
65-69 143 154 83 85
70-74 145 159 82 85

Exercise 10A: Measuring Blood Pressure:
Note: These labs are ONLY for experimental, and not diagnostic, purposes.

A sphygmomanometer (blood pressure cuff) is used to measure blood pressure. The cuff, designed to fit around the upper arm, can be expanded by pumping a rubber bulb connected to the cuff. The pressure gauge, scaled in millimeters, indicates the pressure inside the cuff. A stethoscope is used to listen to the individual’s pulse. The ear pieces of the stethoscope should be cleaned with alcohol swabs before and after each use.

Procedure:
1. Work in pairs. Those who are to have their blood pressure measured should be seated with both shirt sleeves rolled up.

2. Attach the cuff of the sphygmomanometer snugly around the upper arm.

3. Place the stethoscope directly below the cuff in the bend of the elbow joint.

4. Close the valve of the bulb by turning it clockwise. Pump air into the cuff until the pressure gauge goes past 200 mm Hg.

5. Turn the valve of the bulb counterclockwise and slowly release the air from the cuff. Listen for pulse.

6. When you first hear the heart sounds, note the pressure on the gauge. This is the systolic pressure.

7. Continue to slowly release air and listen until the clear thumping sound of the pulse becomes strong and then fades. When you last hear the full heart beat, note the pressure. This is the diastolic pressure.

8. Repeat the measurement two more times and determine the average systolic and diastolic pressure, then record these values on the data sheet .

9. Trade places with your partner. When your average systolic and diastolic pressure have been determined, record these values on the blood pressure data sheet.

Exercise 10B: A Test of Fitness
The point scores on the following tests provide an evaluation of fitness based not only on cardiac muscular development but also on the ability of the cardiovascular system to respond to sudden changes in demand. Caution: Make sure that you do not attempt this exercise if strenuous activity will aggravate a health problem. work in pairs. Determine the fitness level for one member of the pair (Tests 1 to 5 below) and then repeat the process for the other member of the pair.

Procedure:
1. The subject should recline on a laboratory bench for at least 5 minutes. At the end of this time, measure the systolic and diastolic pressure and record these values below.

reclining systolic pressure ____________ mm Hg    reclining diastolic pressure _______ mm Hg

2. Remain reclining for two minutes, then stand and IMMEDIATELY repeat measurements on the same subject (arms down). Record these values below.

standing systolic pressure ____________ mm Hg    standing diastolic pressure _______ mm Hg

3. Determine the change in systolic pressure from reclining to standing by subtracting the standard measurement from the reclining measurement. Assign fitness points based on Table 10.2 and record the fitness data sheet.

Table 10.2: Changes in Systolic Pressure from Reclining to Standing

Change (mm Hg) Fitness Points
rise of 8 or more 3
rise of 2-7 2
no rise 1
fall of 2-5 0
fall of 6 or more -1

Cardiac Rate and Physical Fitness

During physical exertion, the cardiac rate (beats per minute) increases. This increase can be measured as an increase in pulse rate. Although the maximum cardiac rate is usually the same in people of the same age group, those who are physically fit have a higher stroke volume millimeters per beat) then more sedentary individuals. A person who is in poor physical condition, therefore, reaches their maximum cardiac rate at a lower work level than a person with of comparable age who is in better shape. Maximum cardiac rates are listed in Table 10.3. Individuals who are in good physical condition can deliver more oxygen to their muscles before reaching maximum cardiac rate than can those in poor condition.

Table 10.3: Maximum-Pulse Rate

Age (years) Maximum Pulse Rate (beats/min)
20-29 190
30-39 160
40-49 150
50-59 140
60 and above 130

Test 2: Standing Pulse Rate
Procedure:
1. The subject should stand at ease for 2 minutes after Test 1.

2. After the two minutes, determine your partner’s pulse.

3. Count the number of beats for 30 seconds and multiply by 2. The pulse rate is the number of beats per minute. Record this on the fitness data sheet. Assign fitness points based on Table 10.4 and record them on the data sheet.

Pulse Rate (beats/min) Fitness Points
60-70 3
71-80 3
81-90 2
91-100 1
101-110 1
111-120 0
121-130 0
131-140 -1

Test 3: Reclining Pulse Rate
Procedure:
1. The subject should recline for 5 minutes on the laboratory bench.

2. The other partner will determine the subject’s resting pulse.

3. Count the number of beats for 30 seconds and multiply by 2. ( Note: the subject should remain reclining for the next test!) Record it on the Data Sheet. Assign fitness points based on Table 10.5 and record them on the fitness data sheet.

Table 10.5: Reclining Pulse Rate

Pulse Rate (beats/min) Fitness Points
50-60 3
61-70 3
71-80 2
81-90 1
91-100 0
101-110 -1

Test 4: Baroreceptor Reflex (Pulse Rate Increase from Reclining to Standing)
Procedure:
1. The reclining subject should now stand up.

2. Immediately take the subject’s pulse. Record this value below. The observed increase in pulse rate is initiated by baroreceptors (pressure receptors) in the carotid artery and in the aortic arch. When the baroreceptors detect a drop in blood pressure they signal the medulla of the brain to increase the heart beat, and consequently the pulse rate.

Pulse immediately upon standing = ___________________ beats per minute

3. Subtract the reclining pulse rate (recorded in Test 3) from the pulse rate immediately upon standing (recorded in Test 4) to determine the pulse rate increase upon standing. Assign fitness points based on Table 10.6 and record on the fitness data sheet.

Table 10.6: Pulse Increase from Reclining to Standing

Reclining Pulse (beats/min)

Pulse Rate Increase on Standing (# beats)

0-10 11-18 19-26 27-34 35-43

Fitness Points

50-60 3 3 2 1 0
61-70 3 2 1 0 -1
71-80 3 2 0 -1 -2
81-90 2 1 -1 -2 -3
91-100 1 0 -2 -3 -3
101-110 0 -1 -3 -3 -3

Test 5: Step Test- Endurance
Procedure:
1. place your right foot on an 18-inch high stool. Raise your body so that your left foot comes to rest by your right foot. Return your left foot to the original position. Repeat these exercise five times, allowing three seconds for each step up.

2. Immediately after the completion of the exercise, measure the pulse for 15 seconds and record below; measure again for 15 seconds and record; continue taking the pulse and record at 60, 90, and 120 seconds.

Number of beats in the 0-to 15 second interval ____ X4= ____ beats per minute

Number of beats in the 16-to 30 second interval ____ X4= ____ beats per minute

Number of beats in the 31-to 60 second interval ____ X4= ____ beats per minute

Number of beats in the 61-to 90 second interval ____ X4= ____ beats per minute

Number of beats in the 91-to 120 second interval ____ X4= ____ beats per minute

3. Observe the time that it takes for the pulse rate to return to approximately the level as recorded in Test 2. Assign fitness pints based on Table 10.7 and record them on the fitness data sheet.

Table 10.7: Time Required for Return of Pulse Rate to Standing Level after Exercise

Time (seconds) Fitness Points
0-30 4
31-60 3
61-90 2
91-120 1
121+ 1
1-10 beats above standing pulse rate 0
11-30 beats above standing pulse rate -1

4. Subtract your normal standing pulse rate (recorded in Test 2) from your pulse rate immediately after exercise (the 0-to 15-second interval) to obtain pulse rate increase. Record this on the data sheet. Assign fitness points based on Table 10.8 and record them on the fitness data sheet.

Standing Pulse (beats/min)

Pulse Rate Increase Immediately after Exercise (#beats)

0-10 11-20 21-30 31-40 41+

Fitness Points

60-70 3 3 2 1 0
71-80 3 2 1 0 -1
81-90 3 2 1 -1 -2
91-100 2 1 0 -2 -3
101-110 1 0 -1 -3 -3
111-120 1 -1 -2 -3 -3
121-130 0 -2 -3 -3 -3
131-140 0 -3 -3 -3 -3

Data Sheet:

Blood Pressure Data

Measurement 1 2 3 Average
Systolic
Diastolic

Fitness Data

Measurement Points
Test 1. Change in systolic pressure from reclining to standing           mm Hg
Test 2. Standing Pulse Rate           beats/min
Test 3. Reclining Pulse Rate          beats/min
Test 4. Baroreceptor reflex Pulse Rate increase on standing          beats/min
Test 5. Return of Pulse Rate to Standing after Exercise           seconds
Pulse Rate increase immediately after exercise           beats/min
Total Score


Total Score Relative Cardiac Fitness
18-17 Excellent
16-14 Good
13-8 Fair
7 or less Poor

Topics for Discussion:
1. Explain why blood pressure and heart rate differ when measured in a reclining position and in a standing position.

___________________________________________________________________

___________________________________________________________________

___________________________________________________________________

___________________________________________________________________

___________________________________________________________________

___________________________________________________________________

2. Explain why high blood pressure is a health concern.

___________________________________________________________________

___________________________________________________________________

___________________________________________________________________

___________________________________________________________________

___________________________________________________________________

___________________________________________________________________

3. Explain why an athlete must exercise harder or longer to achieve a maximum heart rate than a person who is not as physically fit.

___________________________________________________________________

___________________________________________________________________

___________________________________________________________________

___________________________________________________________________

___________________________________________________________________

___________________________________________________________________

4. Research and explain why smoking causes a rise in blood pressure.

___________________________________________________________________

___________________________________________________________________

___________________________________________________________________

___________________________________________________________________

___________________________________________________________________

___________________________________________________________________

Pasteur Experiment

Recreation of Pasteur’s Experiment

Introduction:

Today, we take many things in science for granted. Many experiments have been performed and much knowledge has been accumulated that people didn’t always know. For centuries, people based their beliefs on their interpretations of what they saw going on in the world around them without testing their ideas to determine the validity of these theories — in other words, they didn’t use the scientific method to arrive at answers to their questions. Rather, their conclusions were based on untested observations.

Among these ideas, for centuries, since at least the time of Aristotle (4th Century BC), people (including scientists) believed that simple living organisms could come into being by spontaneous generation. This was the idea that non-living objects can give rise to living organisms. It was common “knowledge” that simple organisms like worms, beetles, frogs, and salamanders could come from dust, mud, etc., and food left out, quickly “swarmed” with life. For example:

Observation: Every year in the spring, the Nile River flooded areas of Egypt along the river, leaving behind nutrient-rich mud that enabled the people to grow that year’s crop of food. However, along with the muddy soil, large numbers of frogs appeared that weren’t around in drier times. Conclusion: It was perfectly obvious to people back then that muddy soil gave rise to the frogs.

Objective:

In this experiment, you will conduct an experiment similar to the one done by Pasteur whenever he disproved spontaneous generation.


Materials Needed:Experiment Set-Up

  • Low-salt broth (chicken or beef, home-made or purchased)
  • 2  250-mL Erlenmeyer flasks
  • 2  1-hole rubber stoppers with bent glass tubing inserted (see diagram)
  • Glycerine
  • Hot plate & pot holders
  • 50-ml Graduated Cylinder
  • Marker

Procedure:

  1. Students should work in teams of 2 to 3 people. Each team should perform the following steps.
  2. Use glycerine and a twisting motion to insert glass tubing into the stoppers. be sure to rinse off excess glycerine with water.
  3. Mark Erlenmeyer flasks accordingly:
    1. Flask 1 with stopper and glass tube going straight up
    2. Flask 2 with stopper and glass tube bent in S-curve
  4. Using a graduated cylinder, place about 50-mL of broth in each Erlenmeyer flask.
  5. Place appropriate lids on flasks.
  6. Use a hot plate to boil broth in flasks with appropriate lids on them for 30 min., then let cool.
  7. For the next ten days, observe the flasks and record any changes in color, turbidity, smell, etc. (Be careful to NOT remove the stoppers from the flasks.)

Data:

Microbial Growth Record
Record the appearance of the flask contents.

Day Flask 1 with Straight Tubing Day Flask 2 with S-shaped Tubing
1 1
2 2
3 3
4 4
5 5
6 6
7 7
8 8
9 9
10 10

Conclusion:

  1. What was the appearance on the broth in each flask on Day 1?
  2. Was their an observed appearance change in flask 1 over the 10 days? Describe the change, if any.
  3. Was their an observed appearance change in flask 2 over the 10 days? Describe the change, if any.
  4. Explain why there was or was not a change in the appearance of the broth in each flask.
  5. Why do you think the idea of spontaneous generation was believed to be true for so long (1000+ years)?
  6. Did your experiment support spontaneous generation of organisms? Explain why or why not?