| Chromatography of Plant Pigments |
 |
Introduction:
Can chromatography be used to separate mixtures of chemical substances? The purpose of this experiment is to answer this question. In paper chromatography, a liquid sample flows down a vertical strip of absorbent paper, on which the components of a mixture are deposited in specific directions and locations. Chromatography is a tool used to examine and separate mixtures of chemical substances. Chromatography is essential to the separation of pure substances from complex mixtures. Separation results in a chromatographically pure substance. Chromatography allows you to determine the properties of chemical substances.
The relationship between the chromatography paper, mixture, and the solvent is very important in all chromatographic separations. The solvent has to dissolve the mixture that should be separated. The paper must also absorb the components of the mixtures selectively and reversibly. The substances making up the mixture must be evenly dispersed in the water. Chromatography is a simple and inexpensive tool for separating and identifying chemical mixtures if all these things are done.
Hypothesis:
Paper can be used to separate mixed chemicals.
Materials:
The materials used in this lab are filter paper, test tube, rubber stopper, paper clip, metric ruler, black felt-tip pen, pencil, calculator, and water.
Methods:
First, bend a paper clip so that it’s straight with a hook at one end. Push the straight end of the paper clip into the bottom of a cork stopper. Then, hang a thin strip of filter paper on the hooked end of the paper clip and insert the paper strip into the test tube. The paper should not touch the sides and should almost touch the bottom of the test tube. Next, remove the paper strip from the test tube. Now draw a solid 5-mm-wide band about 25 mm from the bottom of the paper, using a black felt tip pen. After this, use a pencil to draw a line across the paper strip 10 cm above the black band. Then, put the filter paper back into the test tube with the bottom of the paper in the water and the black band above the water. Observe what happens as the liquid travels up the paper and record the changes you see. When the solvent has reached the pencil line, remove the paper from the test tube. Let the paper dry on the desk. Finally, with a metric ruler, measure the distances from the starting point to the top edge of each color. Record the data in a data table and calculate a ratio for each color by dividing the distance, the color traveled by the distance the solvent traveled.
Results:
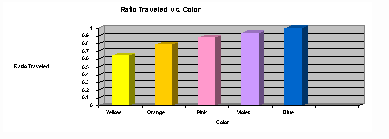
The results of the chromatography experiment are shown in a chart and a graph.
| Color of ink (list in order) |
Distance traveled by each color (mm) |
Distance solvent traveled (mm) |
Ratio traveled = distance color moved divided by distance solvent moved |
| Yellow |
70 |
108 |
0.65 |
| Orange |
85 |
108 |
0.79 |
| Pink |
95 |
108 |
0.88 |
| Violet |
102 |
108 |
0.94 |
| Blue |
108 |
108 |
1.00 |
Questions:
1. How many colors separated from the black ink? Five colors separated from the ink: yellow, orange, pink, violet, and blue.
2. What served as the solvent for the ink? Water served as the solvent for the ink.
3. As the solvent traveled up the paper, which color of ink appeared first? Dark blue appeared first.
4. List the colors in order from top to bottom that separated from the black ink? The colors separated in the order of: blue, violet, pink, orange, and yellow.
5. In millimeters, how far did the solvent travel? The solvent traveled 108 mm.
6. From your results, what can you conclude is true about black ink? Black ink is a mixture of several different colors.
7. Why did the inks separate? The inks separated because black ink is a mixture of different pigments that are soluble in water, have different molecular characteristics, and travel different distances.
8. Why did some inks move a greater distance? Some inks move a greater distance because molecules in ink have different characteristics, like how readily they are absorbed by paper. This means that the ink least readily absorbed by paper will travel farthest from the starting mark and the ink most readily absorbed by paper will be the closest to the starting mark. All of the different color inks that were separated were different in how readily they are absorbed by paper.
Error Analysis:
There are a few errors that could have changed the results. First, there could be inaccurate measurements of how far every color traveled or how far the water traveled up the filter paper. Another error could occur when calculating the ratio traveled, Rf value. Also, a longer test tube could have been used by different groups which would make the filter strip longer. This means that a group could have detected another color because they had more room on their filter paper. This also could have affected the ratios. Finally, the groups could have put different amounts of black ink on the filter paper.
Conclusion:
The hypothesis that paper can be used to separate mixed chemicals was correct. The different colored inks mixed together give the black its color. The five colors that separated from the black ink were blue, violet, pink, orange, and yellow. Blue appeared first and then was followed by violet, pink, orange, and yellow. The colors separated the way they did because they have different molecular characteristics, like how readily they were absorbed by the paper and their solubility in water. Blue was most readily absorbed by the paper and soluble by water, while yellow was the least.