chromatography of plant pigments3


Chromatography of Plant Pigments


Introduction:


Can chromatography be used to separate mixtures of chemical substances? The purpose of this experiment is to answer this question. In paper chromatography, a liquid sample flows down a vertical strip of absorbent paper, on which the components of a mixture are deposited in specific directions and locations. Chromatography is a tool used to examine and separate mixtures of chemical substances. Chromatography is essential to the separation of pure substances from complex mixtures. Separation results in a chromatographically pure substance. Chromatography allows you to determine the properties of chemical substances.

The relationship between the chromatography paper, mixture, and the solvent is very important in all chromatographic separations. The solvent has to dissolve the mixture that should be separated. The paper must also absorb the components of the mixtures selectively and reversibly. The substances making up the mixture must be evenly dispersed in the water. Chromatography is a simple and inexpensive tool for separating and identifying chemical mixtures if all these things are done.


Hypothesis:


Paper can be used to separate mixed chemicals.


Materials:


The materials used in this lab are filter paper, test tube, rubber stopper, paper clip, metric ruler, black felt-tip pen, pencil, calculator, and water.


Methods:


First, bend a paper clip so that it’s straight with a hook at one end. Push the straight end of the paper clip into the bottom of a cork stopper. Then, hang a thin strip of filter paper on the hooked end of the paper clip and insert the paper strip into the test tube. The paper should not touch the sides and should almost touch the bottom of the test tube. Next, remove the paper strip from the test tube. Now draw a solid 5-mm-wide band about 25 mm from the bottom of the paper, using a black felt tip pen. After this, use a pencil to draw a line across the paper strip 10 cm above the black band. Then, put the filter paper back into the test tube with the bottom of the paper in the water and the black band above the water. Observe what happens as the liquid travels up the paper and record the changes you see. When the solvent has reached the pencil line, remove the paper from the test tube. Let the paper dry on the desk. Finally, with a metric ruler, measure the distances from the starting point to the top edge of each color. Record the data in a data table and calculate a ratio for each color by dividing the distance, the color traveled by the distance the solvent traveled.


Results:


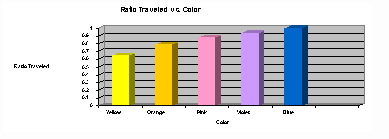
The results of the chromatography experiment are shown in a chart and a graph.


Color of ink (list in order) Distance traveled by each color (mm) Distance solvent traveled (mm) Ratio traveled = distance color moved divided by distance solvent moved
Yellow 70 108 0.65
Orange  

85


108


0.79

Pink 95  

108


0.88

Violet 102  

108


0.94

Blue 108  

108


1.00


Questions:

1. How many colors separated from the black ink? Five colors separated from the ink: yellow, orange, pink, violet, and blue.


2. What served as the solvent for the ink? Water served as the solvent for the ink.


3. As the solvent traveled up the paper, which color of ink appeared first? Dark blue appeared first.


4. List the colors in order from top to bottom that separated from the black ink? The colors separated in the order of: blue, violet, pink, orange, and yellow.


5. In millimeters, how far did the solvent travel? The solvent traveled 108 mm.


6. From your results, what can you conclude is true about black ink? Black ink is a mixture of several different colors.


7. Why did the inks separate? The inks separated because black ink is a mixture of different pigments that are soluble in water, have different molecular characteristics, and travel different distances.


8. Why did some inks move a greater distance? Some inks move a greater distance because molecules in ink have different characteristics, like how readily they are absorbed by paper. This means that the ink least readily absorbed by paper will travel farthest from the starting mark and the ink most readily absorbed by paper will be the closest to the starting mark. All of the different color inks that were separated were different in how readily they are absorbed by paper.

Error Analysis:


There are a few errors that could have changed the results. First, there could be inaccurate measurements of how far every color traveled or how far the water traveled up the filter paper. Another error could occur when calculating the ratio traveled, Rf value. Also, a longer test tube could have been used by different groups which would make the filter strip longer. This means that a group could have detected another color because they had more room on their filter paper. This also could have affected the ratios. Finally, the groups could have put different amounts of black ink on the filter paper.


Conclusion:


The hypothesis that paper can be used to separate mixed chemicals was correct. The different colored inks mixed together give the black its color. The five colors that separated from the black ink were blue, violet, pink, orange, and yellow. Blue appeared first and then was followed by violet, pink, orange, and yellow. The colors separated the way they did because they have different molecular characteristics, like how readily they were absorbed by the paper and their solubility in water. Blue was most readily absorbed by the paper and soluble by water, while yellow was the least.

BACK


Chromatography of Plant Pigments 3


Chromatography of Plant Pigments


Introduction:


Can chromatography be used to separate mixtures of chemical substances? The purpose of this experiment is to answer this question. In paper chromatography, a liquid sample flows down a vertical strip of absorbent paper, on which the components of a mixture are deposited in specific directions and locations. Chromatography is a tool used to examine and separate mixtures of chemical substances. Chromatography is essential to the separation of pure substances from complex mixtures. Separation results in a chromatographically pure substance. Chromatography allows you to determine the properties of chemical substances.

The relationship between the chromatography paper, mixture, and the solvent is very important in all chromatographic separations. The solvent has to dissolve the mixture that should be separated. The paper must also absorb the components of the mixtures selectively and reversibly. The substances making up the mixture must be evenly dispersed in the water. Chromatography is a simple and inexpensive tool for separating and identifying chemical mixtures if all these things are done.


Hypothesis:


Paper can be used to separate mixed chemicals.


Materials:


The materials used in this lab are filter paper, test tube, rubber stopper, paper clip, metric ruler, black felt-tip pen, pencil, calculator, and water.


Methods:


First, bend a paper clip so that it’s straight with a hook at one end. Push the straight end of the paper clip into the bottom of a cork stopper. Then, hang a thin strip of filter paper on the hooked end of the paper clip and insert the paper strip into the test tube. The paper should not touch the sides and should almost touch the bottom of the test tube. Next, remove the paper strip from the test tube. Now draw a solid 5-mm-wide band about 25 mm from the bottom of the paper, using a black felt tip pen. After this, use a pencil to draw a line across the paper strip 10 cm above the black band. Then, put the filter paper back into the test tube with the bottom of the paper in the water and the black band above the water. Observe what happens as the liquid travels up the paper and record the changes you see. When the solvent has reached the pencil line, remove the paper from the test tube. Let the paper dry on the desk. Finally, with a metric ruler, measure the distances from the starting point to the top edge of each color. Record the data in a data table and calculate a ratio for each color by dividing the distance, the color traveled by the distance the solvent traveled.


Results:


The results of the chromatography experiment are shown in a chart and a graph.


Color of ink (list in order) Distance traveled by each color (mm) Distance solvent traveled (mm) Ratio traveled = distance color moved divided by distance solvent moved
Yellow 70 108 0.65
Orange  

85


108


0.79

Pink 95  

108


0.88

Violet 102  

108


0.94

Blue 108  

108


1.00


Questions:

1. How many colors separated from the black ink? Five colors separated from the ink: yellow, orange, pink, violet, and blue.


2. What served as the solvent for the ink? Water served as the solvent for the ink.


3. As the solvent traveled up the paper, which color of ink appeared first? Dark blue appeared first.


4. List the colors in order from top to bottom that separated from the black ink? The colors separated in the order of: blue, violet, pink, orange, and yellow.


5. In millimeters, how far did the solvent travel? The solvent traveled 108 mm.


6. From your results, what can you conclude is true about black ink? Black ink is a mixture of several different colors.


7. Why did the inks separate? The inks separated because black ink is a mixture of different pigments that are soluble in water, have different molecular characteristics, and travel different distances.


8. Why did some inks move a greater distance? Some inks move a greater distance because molecules in ink have different characteristics, like how readily they are absorbed by paper. This means that the ink least readily absorbed by paper will travel farthest from the starting mark and the ink most readily absorbed by paper will be the closest to the starting mark. All of the different color inks that were separated were different in how readily they are absorbed by paper.

Error Analysis:


There are a few errors that could have changed the results. First, there could be inaccurate measurements of how far every color traveled or how far the water traveled up the filter paper. Another error could occur when calculating the ratio traveled, Rf value. Also, a longer test tube could have been used by different groups which would make the filter strip longer. This means that a group could have detected another color because they had more room on their filter paper. This also could have affected the ratios. Finally, the groups could have put different amounts of black ink on the filter paper.


Conclusion:


The hypothesis that paper can be used to separate mixed chemicals was correct. The different colored inks mixed together give the black its color. The five colors that separated from the black ink were blue, violet, pink, orange, and yellow. Blue appeared first and then was followed by violet, pink, orange, and yellow. The colors separated the way they did because they have different molecular characteristics, like how readily they were absorbed by the paper and their solubility in water. Blue was most readily absorbed by the paper and soluble by water, while yellow was the least.

BACK


Chromatography of Simulated Plant Pigments


Chromatography of Simulated Plant Pigments


Introduction
    This experiment is conducted to investigate the components Plant Pigments separating visibly. There are a couple of different types of components in plant pigments, and they became clearly visible during this lab. The most important and abundant chemical pigment found in plants is chlorophyll. This pigment exists in two forms; chlorophyll a and chlorophyll b. Chlorophyll absorbs two main colors from light quite well. These are blue, and red. The chlorophyll reflects green light very well, however, the two different types of chlorophyll have their maximum absorption at different wavelengths of light. Chlorophyll a, being the main photosynthetic pigment, has a primary purpose to convert light energy to chemical energy used by the plant itself. Chlorophyll b absorbs light in a region of the spectrum apart from the dominant chlorophyll, and transfers the energy it produces to chlorophyll a. Along with chlorophyll b in transferring their energy produced to the dominant chlorophyll, two other pigments that are found in plants are carotenes and xanthophylls, which are orange and yellow respectively. Since chlorophyll is such a dominant pigment in green plants, this domination hides the color of the carotenes and xanthophylls in the leaves. This causes most plant leaves to appear green most of the time. During the autumn, however, the chlorophyll starts to break down, causing the carotenes and xanthophylls to show their bright red, orange and yellow colors.
These brilliant colors can be separated another way. This different technique, known as paper chromatography, separates mixtures in a liquid into individual components. The technique is based on the fact that each substance in a mixture has a specific affinity for a solid surface and a specific solubility in different solvents. By this method, the solid surface is the cellulose fibers in the chromatography paper, and the solvent is the solution that was placed in the bottom of the developing chamber.
This separation takes place through a process of absorption and capillary action. Just a small drop of the mixture, in this case plant pigment to be separated, is placed at the bottom of the strip of chromatography paper. The chromatography paper is then placed in the developing chamber with a solvent, which wicks up the paper, pulling the solvent up the paper by capillary action, and the mixture of pigments is dissolved as the solvent passes over it. The different components of the mixture move upward at different rates. A compound with greater solubility will travel farther than one with less solubility. The pigments then show up as color streaks on the chromatography paper. These substances have formed a pattern called a chromatogram on the chromatography paper.
The Rf values for each pigment is calculated to establish the relative rate of migration for each pigment. This value represents the ratio of the distance a pigment traveled on the chromatogram relative to the distance the solvent front moved.
Scientists use the Rf value of a sample to identify the molecule. Any molecule in a given solvent matrix system has a uniquely consistent Rf value. The formula for this value is as follows:

Rf = Distance each pigment traveled ¸ Distance solvent front traveled


Hypothesis
    Using paper chromatography, the pigments that give a leaf its color can be separated and observed to determine the Rf value of each pigment and their function during photosynthesis.


Materials
For this experiment the following items are used — one chromatography reaction chamber, one paper chromatography strip, one capillary pipette, a pencil and paper, calculator, ruler, 50 ml beaker, colored pencils, approximately 10 ml of solvent depending on the size of the reaction chamber, scissors, and simulated plant pigment.


Procedure
Use scissors to cut the bottom of the chromatography paper to a tapered end. Measure the strip and cut the length to equal slightly longer than the reaction chamber. Draw a faint pencil line at the bottom of the tapered end and use a capillary pipette to add some simulated plant pigment to this line. Add 5-10 ml of solvent to the reaction chamber. Extend the chromatography strip through the slit in the lids of the reaction chamber and carefully lower the strip into the chamber so the tapered end is in the solvent and the pencil line is above the solvent level. Make sure the strip does not touch the walls of the chamber and do not bump the chamber as the pigments begin to separate. After the pigments have completely separated and the solvent front has reached the top of the chamber, remove the strip and mark the solvent front with a pencil line before it evaporates. Measure and record the distance the solvent and each pigment traveled. Use a calculator to determine the Rf values for each pigment.


Data


Table 1

Band # Pigment Color Migration distance (mm) Rf value
1 Carotene Orange 59mm .94
2 Xanthophyll Yellow 56mm .89
3 Chlorophyll a Light green 29mm .46
4 Chlorophyll b Dark green 14mm .22
Solvent 63mm

Questions
1. Describe what happened to the original spot of simulated plant pigments?
  The solvent separated  the original spot by wicking up the solvent while dissolving the various pigments in the spot.
2. List some other uses of chromatography?  Chromatography can be used to separate various mixtures of subtances, liquids and gases.
3. Which of the 4 pigments migrated the furthest and why?  carotene ( orange) because it was the most soluble in the solvent
4. Which type of chlorophyll was the most soluble?  chlorophyll a
5. Explain why leaves change color in the fall?  In Autumn, chlorophyll starts to break down which allows the other brilliant plant pigment colors to show. These pigments include the red, orange, and yellow colors.
6. What is the function of plant pigments in photosynthesis?  Plant pigments trap light energy and convert it into chemical energy that can be used by the plant to make glucose or sugar.

Error Analysis
The chromatography paper touched the sides of the chamber during the waiting time which caused the migration to go slightly to the side instead of straight to the top. Also the strip was bent at the top so there could have been a slight error in measuring the migration of the solvent  front.

Conclusion
Paper chromatography proved to be an accurate method of separating and observing the various colors of plant pigments. The pigments dissolved in the solvent and migrated upward. The colors were observed and their migration distances measured & recorded. The
Rf value of each pigment was determined by dividing its migration by the migration of the solvent.  It was determined that 4 pigments were present in the original spot — carotene, xanthophyll, chlorophyll a, and chlorophyll b. Carotene was the most soluble, while chlorophyll b was the least soluble.

Chromatography Plant Pigments


Chromatography of Plant Pigments

INTRODUCTION:

Chlorophyll often hides the other pigments present in leaves. In Autumn, chlorophyll breaks down, allowing xanthophyll and carotene, and newly made anthocyanin, to show their colors.
The mix of pigments in a leaf may be separated into bands of color by the technique of paper chromatography. Chromatography involves the separation of mixtures into individual components. Chromatography means “color writing.” With this technique the components of a mixture in a liquid medium are separated. The separation takes place by absorption and capillarity. The paper holds the substances by absorption; capillarity pulls the substances up the paper at different rates. Pigments are separated on the paper and show up as colored streaks. The pattern of separated components on the paper is called a chromatogram.

PRELAB PREPARATION:

Gather leaves from several different plants. CAUTION: Avoid poisonous plants. Autumn leaves from deciduous trees are especially interesting. Sort the leaves by kind (maple, etc.) and color. Review a diagram of a plant cell . Find the grana and the chloroplasts of the cell.

MATERIALS:

Safety goggles
Chromatography solvent (92 parts Petroleum ether to 8 parts acetone)
Chromatography paper (or filter paper) about 1 cm x 15 cm
Ethyl alcohol
Fresh spinach
Test tube
Test tube rack
Scissors and Ruler
Fresh leaves of plants
Glass stirring rod
Paper clip
Cork (to fit test tube)
Mortar and pestle
Sand (optional)
10-ml Graduated cylinder

PROCEDURE:

Leaves should be grouped by kind (maple, etc.) and color. Work with a spinach leaf and with one or more other types. CAUTION: Chromatography solvents are flammable and toxic. Have no open flames; maintain good ventilation; avoid inhaling fumes.

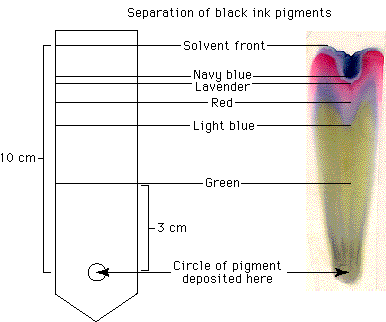
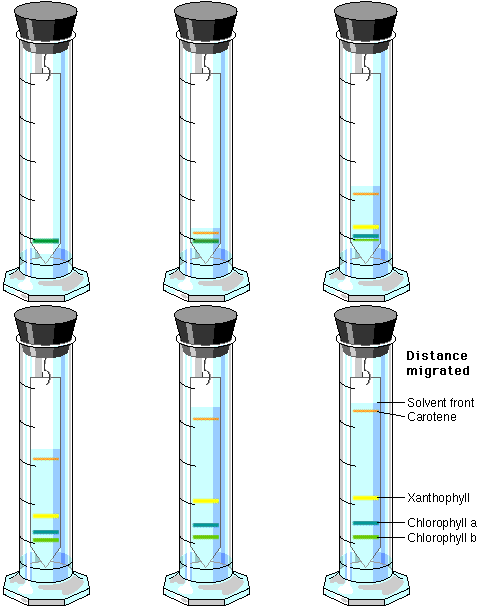
1. Cut a strip of filter paper or chromatography paper so that it just fits inside a 15-cm (or larger) test tube. Cut a point at one end. Draw a faint pencil line as shown in figure 1. Bend a paper clip and attach it to a cork stopper. Attach the paper strip so that it hangs inside the tube, as shown. The sides of the strip should not touch the glass.

2. Tear a spinach leaf into pieces about the size of a postage stamp. Put them into a mortar along with a pinch or two of sand to help with grinding. Add about 5 ml ethyl alcohol to the leaf pieces. Crush leaves with the pestle, using a circular motion, until the mixture is finely ground. The liquid in which the leaf pigments are now for paper chromatography dissolved is called the pigment extract.

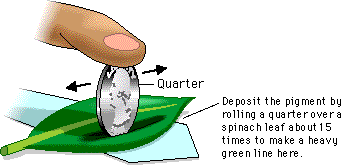
3. Use a glass rod to touch a drop of the pigment extract to the center of the pencil line on the paper strip. Let it dry. Repeat as many as 20 times, to build up the pigment spot. NOTE: You must let the dot dry after each drop is added. The drying keeps the pigment dot from spreading out too much.

4. Pour 5 ml chromatography solvent into the test tube. Fit the paper and cork assembly inside. Adjust it so that the paper point just touches the solvent (but not the sides of the tube). The pigment dot must be above the level of the solvent. Watch the solvent rise up the paper, carrying and separating the pigments as it goes. At the instant the solvent reaches the top, remove the paper and let it dry. Observe the bands of pigment. The order, from the top, should be carotenes (orange), xanthophylls (yellow), chlorophyll a (yellow-green), chlorophyll b (blue-green), and anthocyanin (red). Identify and label the pigment bands on the dry strip. Write the species of leaf on the strip as well.
Record the species, external color, and chromatogram pigments in the DATA TABLE of your report sheet.

5. Each pigment has an Rf value, the speed at which it moves over the paper compared with the speed of the solvent.

Rf = Distance moved by the pigment / Distance moved by the solvent

Measure the distance in cm from the starting point (pencil line) to the center of each pigment band. Then measure the entire distance traveled by the solvent. Remember, the starting point for the solvent is also the pencil line and the ending point for the solvent is the top edge of the paper. Do the required divisions and record your Rf values in the DATA TABLE of your report sheet.

6. Wash the mortar and pestle thoroughly, using a little alcohol to remove any remaining pigment.

7. Repeat steps 1 through 6 for each species.

DATA TABLE:

Chromatography Data

Leaf Type (species) External color Chromatogram Pigments
Colors from the Top Pigment Names Rf Values


Chapter 8 Membrane Structure Objectives


Chapter 8   Introduction to Metabolism
Objectives
Metabolism, Energy, and Life

1.        Explain the role of catabolic and anabolic pathways in cellular metabolism.

2.        Distinguish between kinetic and potential energy.

3.        Explain why an organism is considered an open system.

4.        Explain the first and second laws of thermodynamics in your own words.

5.        Explain why highly ordered living organisms do not violate the second law of thermodynamics.

6.        Write and define each component of the equation for free-energy change.

7.        Distinguish between exergonic and endergonic reactions in terms of free energy change.

8.        Explain why metabolic disequilibrium is one of the defining features of life.

9.        List the three main kinds of cellular work. Explain in general terms how cells obtain the energy to do cellular work.

10.       Describe the structure of ATP and identify the major class of macromolecules to which ATP belongs.

11.       Explain how ATP performs cellular work.

Enzymes Are Catalytic Proteins

12. Describe the function of enzymes in biological systems.

13. Explain why an investment of activation energy is necessary to initiate a spontaneous reaction.

14. Explain how enzyme structure determines enzyme specificity.

15. Explain the induced-fit model of enzyme function.

16. Describe the mechanisms by which enzymes lower activation energy.

17. Explain how substrate concentration affects the rate of an enzyme-catalyzed reaction.

18. Explain how temperature, pH, cofactors, and enzyme inhibitors can affect enzyme activity.

The Control of Metabolism

19. Explain how metabolic pathways are regulated.

20. Explain how the location of enzymes in a cell may help order metabolism


BACK