Mitosis and Meiosis
Introduction
All new cells come from previously existing cells. New cells are formed by the process of cell division which involves both replication of the cell’s nucleus (karyokinesis) and division of the cytoplasm( cytokinesis).
There are two types of nuclear division: mitosis and meiosis. Mitosis typically results in new somatic (body ) cells. Formation of an adult organism from a fertilized egg, asexual reproduction, regeneration, and maintenance or repair of body parts are accomplished through mitotic cell division. Meiosis results in the formation of either gametes (in animals) or spores ( in plants). These cells have half the chromosome number of the parent cell. You will study meiosis in Exercise 3B. Where does one find cells undergoing meiosis? Plants and animals differ in this respect. In higher plants the process of forming new cells is restricted to special growing regions called meristems. These regions usually occur at the tips of stems or roots. In animals, cell division occurs anywhere new cells are formed or as new cells replace old ones. However, some tissues in both plant and animals rarely divide once the organism is mature.
Exercise 3A.1: Observing Mitosis in Plant and Animal Cells Using Prepared Slides of the Onion Root Tip and Whitefish Blastula
Figure 3.1 Close up view of different stages of mitosis in an onion root tip:

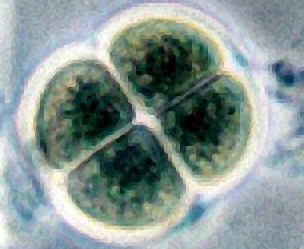
Figure 3.2 Whitefish Blastula
Procedure:
Examine prepared slides of either onion root tips or whitefish blastula. Locate the meristematic region of the onion, or locate the blastula with 10X objective, and then use the 40X objective to study individual cells. Identify one cell which clearly represents each phase of mitosis. Sketch and label the cell in the box provided.
1. The non dividing cell is in a stage called interphase. The nucleus may have one or more dark-stained nucleoli and is filled with a fine network of threads, the chromatin. During interphase, DNA replication occurs.
Interphase
2. The first signs of cell division occurs in prophase. There is a thickening of the chromatin threads, which will continue until it is evident that the chromatin has condensed into chromosomes. With somewhat higher magnification you may be able to see the two chromatids held together by the centromere. As prophase continues , the chromatids continue to thicken and shorten. The nuclear envelope disappears and the beginnings of the spindle apparatus begin to appear.
Prophase
3. At metaphase, the chromosome pairs have moved to the center of the spindle. One particular part of each chromosome, the centromere, attaches to the spindle. The centromeres of all the chromosomes lie about the same level of the spindle called the metaphase plate.
Metaphase
4. At the beginning of anaphase, the centromere regions of each pair of chromatids separate and are moved by the spindle fibers toward opposite poles of the spindle, dragging the rest of the chromatid behind them. Once each chromatid is separate it is called a chromosome.
Anaphase
5. Telophase, the last stage of division, is marked by a pronounced condensation of the chromosomes, followed by the formation of a new nuclear envelope around each group of chromosomes. The chromosomes gradually uncoil into the fine threads of chromatin, and the nucleoli reappears. Cytokinesis may occur. This is the division of the cytoplasm into two new cells. In plants, a new cell wall is laid down between the daughter cells. In animal cells, the old cells will pinch off in the middle along a cleavage furrow to form two new daughter cells.
Telophase
Analysis Questions:
1. Why is it more accurate to call mitosis “nuclear replication” rather than “cellular division”?
_____________________________________________________________________
_____________________________________________________________________
_____________________________________________________________________
_____________________________________________________________________
_____________________________________________________________________
2. Explain why the whitefish blastula and onion root tip are selected for study of mitosis.
_____________________________________________________________________
_____________________________________________________________________
_____________________________________________________________________
_____________________________________________________________________
Exercise 3A.2: Time for Cell Replication
Procedure:
It is hard to imagine that you can estimate how much time a cell spends in each phase of cell replication from a slide of dead cells. Yet this is precisely what you are going to do in this part of the lab. Since you are working with a prepared slide, you cannot get any information about how long it takes a cell to divide. What you can determine is how many cells are in each phase. From this, you can infer the percent of time each cell spends in each phase.
1. Observe every cell in one high power field of view and determine which phase of the cell cycle it is in. This is best done in pairs. The partner observing the slide calls out the phase of each cell while the other partner records. Then switch so the recorder becomes the observer and visa versa. Count at least two full fields of view. If you have not counted 200 cells, then count a third field of view.
2. Record your data in Table 3.1.
Table 3.1
|
Number of Cells
|
Percent of Total Cells Counted |
Time in Each Stage |
|
Field 1 |
Field 2 |
Field 3 |
Total |
|
|
| Interphase |
|
|
|
|
|
|
| Prophase |
|
|
|
|
|
|
| Metaphase |
|
|
|
|
|
|
| Anaphase |
|
|
|
|
|
|
| Telophase |
|
|
|
|
|
|
| Total Cells Counted |
|
|
|
|
|
|
3. Calculate the percentage of cells in each phase.
Consider it takes, on average, 24 hours (or 1,440 minutes) for onion root-tip cells to complete the cell cycle. You can calculate the amount of time spent in each phase of the cell cycle from the percent of cells in that stage.
Percent of cells in stage X 1,440 minutes = ___________ minutes of cell cycle spent in stage.
Questions:
1. If your observations had not been restricted to the area of the root tip that is actively dividing, how would your results have been different?
_____________________________________________________________________
_____________________________________________________________________
_____________________________________________________________________
_____________________________________________________________________
_____________________________________________________________________
2. Based on the data in Table 3.1, what can you infer about the relative length of time an onion root-tip cell spends in each stage of cell division?
_____________________________________________________________________
_____________________________________________________________________
_____________________________________________________________________
_____________________________________________________________________
_____________________________________________________________________