pH in Living Systems


pH and Living Systems
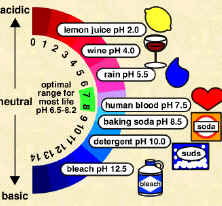
 

Introduction:

Scientists use something called the pH scale to measure how acidic or basic a liquid is. The scale goes from 0 to 14. Distilled water is neutral and has a pH of 7. Acids are found between 0 and 7. Bases are from 7 to 14. Most of the liquids you find every day have a pH near 7. They are either a little below or a little above that mark. When you start looking at the pH of chemicals, the numbers go to the extremes. Substances with the highest pH (strong bases) and the lowest pH (strong acids) are very dangerous chemicals. Molecules that make up or are produced by living organisms usually only function within a narrow pH range (near neutral) and a narrow temperature range (body temperature). Many biological solutions, such as blood, have a pH near neutral.

The biological molecule used in this lab is a protein found in milk. Proteins are used to build cells and do most of the cell’s work. They also act as enzymes. For proteins to work, they must maintain their globular shape. Changing the shape of a protein denatures and the protein will no longer work.

Materials:

Small squares of wide-range pH paper, pH color chart, paper towels, 4 dropper bottles, ammonia, lemon juice, skim milk, distilled water, forceps, 50 ml beakers, small squares of narrow-range pH paper, 2 stirring rods

Procedure (part A): Testing the pH of Substances

  1. Line up 4 squares of wide-range pH paper about 1 cm apart on a paper towel.
  2. Put one drop of distilled water on the pH square.
  3. Compare the color of the pH paper to the color chart and record the pH in data table 1.
  4. Repeat this procedure for the ammonia, lemon juice, and skim milk.

Questions (Part A): Determining the pH of Solutions

  1. Which substance was the most acidic?
  2. Which substance was the most basic?
  3. Did any of the substances have a pH close to neutral? Name them.

Procedure (part B): Showing the Effect of pH on a Biological Molecule (Milk Proteins)

  1. Place 100 drops of skim milk in a 50 ml beaker.
  2. Pick up a piece of narrow-range pH paper with forceps.
  3. Touch the pH paper to the milk and remove it.
  4. Compare the color of the pH paper to the pH color chart.
  5. Record the initial pH in data table 2.
  6. Add a drop of lemon juice to the milk in the cup & stir with a stirring rod. Keep track of how many drops you add to the milk!
  7. Measure and record the pH of the solution with the narrow-range pH paper.
  8. Repeat step 7 until you notice an obvious change in the appearance of the milk. record this final pH and appearance of the milk in your data table.
  9. Repeat steps 1-8 using a clean 50 ml beaker and fresh milk, and substitute ammonia for the lemon juice.
  10. Add drops of ammonia to the milk until the change in pH of the milk is equal to the change in pH you measured in step 8. Be sure to keep track of the number of drops added. HINT: If the pH changed by 2 units with the lemon juice, then add ammonia until you also get 2 pH units of change!

Data:

Table 1


Substance Tested pH Acid Base Neutral


Table 2

Substance Tested Substance used to Produce Change Starting pH of Milk Final pH of Milk Original Appearance of Milk Final Appearance of Milk Total Number of drops added to Produce the change
100 drops Skim Milk Lemon Juice
100 drops Skim Milk Ammonia

Questions:

1. Which substance tested from table 1 was the most acidic?

2. Which substance was most basic?

3. Did any substance from table 1 have a neutral, or near neutral pH? If so, which substance was neutral?

4. Why did you use narrow-range pH paper to measure the milk’s change in pH?


5. Describe the change in appearance of the milk as more lemon juice was added. Explain why this change occurred.


6. How much did the pH of milk change when lemon juice was added?

7. Why do you think lemon juice “curdled”  (precipitated out the proteins) from the milk?


8. Did you get the same change when ammonia was used? Why or why not?


Nucleotide Model preap


Model of a Nucleotide


Introduction

Nucleotides consist of three parts — a pentose sugar, a nitrogen-containing base, and a phosphate group. A pentose sugar is a five-sided sugar. There are 2 kinds of pentose sugars — deoxyribose and ribose. Deoxyribose has a hydrogen atom attached to its #2 carbon atom (designated 2′), and ribose has a hydroxyl group atom there. Deoxyribose-containing nucleotides are the monomers of DNA, while Ribose-containing nucleotides are the monomers of RNA.

A nitrogen-containing ring structure is called a base. The base is attached to the 1′ carbon atom of the pentose. In DNA, four different bases are found — two purines, called adenine (A) and guanine (G) and two pyrimidines, called thymine (T) and cytosine (C). RNA contains The same purines, adenine (A) and guanine (G).  RNA also uses the pyrimidine cytosine (C), but instead of thymine, it uses the pyrimidine uracil (U).


The Purines The Pyrimidines

The combination of a base and a pentose is called a nucleoside.  A phosphate group is attached to the 5′ carbon of the pentose sugar.

Objective

Students will construct a 3-dimensional model of a single nucleotide, the monomer of which nucleic acids are composed.

Materials

Various materials may be used for the atoms that make up a nucleotide such as styrofoam balls, plastic coke bottle caps, beads, etc. Bonds between atoms may be made from toothpicks, plastic stirring sticks, popsicle sticks, etc. Single & double bonds must be represented by the correct number of “sticks”. The atoms and bonds may NOT be made of any food item. Your model should be glued together to make the model rigid for hanging. Attach string and a label with the nucleotide’s name to your model. Models must be sturdy, light weight, and small enough to hang from the ceiling.

Color Code for atoms:

CARBON – BLACK
HYDROGEN – YELLOW
OXYGEN – RED
NITROGEN – BLUE

Structural Formulas of Nucleotides:

Uracil Nucleotide (Ribose ) & Thymine Nucleotide (Deoxyribose)


Adenine Nucleotide (Deoxyribose)
Cytosine Nucleotide (Deoxyribose)
Guanine Nucleotide (Deoxyribose)


Nucleic Acids & Protein Synthesis

Nucleic Acids and Protein Synthesis
All Materials © Cmassengale

Cell   à   Nucleus    à    Chromosomes   à   Genes    à     DNA 

Proteins

  • Organic molecules (macromolecules) made by cells
  • Make up a large part of your body
  • Used for growth, repair, enzymes, etc.
  • Composed of long chains of small units called amino acids bonded together by peptide bonds
  • Twenty amino acids exist

DNA

  • Deoxyribonucleic acid is a coiled double helix carrying hereditary information of the cell

  • Contains the instructions for making proteins from 20 different amino acids
  • Appears as chromatin when cell not dividing

  • Structure discovered by Watson & Crick in 1953
  • Sides made of pentose (5-sided) sugars attached to phosphate groups by phosphodiester bonds
  • Pentose sugar called Deoxyribose

  • Steps or rungs of DNA made of 4 nitrogen-containing bases held together by weak hydrogen bonds
  • Purines (double carbon-nitrogen rings) include adenine (A) and guanine (G)
  • Pyrimidines (single carbon-nitrogen rings) include thymine (T) and cytosine (C)

  • Base pairing means a purine bonds to a pyrimidine   (Example:  A — T   and   C — G)
  • Coiled, double stranded molecule known as double helix
  • Make up chromosomes in the nucleus
  • Subunits of DNA called nucleotides
  • Nucleotides contain a phosphate, a Deoxyribose sugar, and one nitrogen base (A,T,C, or G)

  • Free nucleotides also exist in nucleus
  • Most DNA is coiled or twisted to the right
  • Left twisted DNA is called southpaw or Z-DNA
  • Hot spots which can result in mutations occur where right & left twisted DNA meet


History of DNA discovery

  • Freidrich Miescher (1868) found nuclear material to be ½ protein & ½ unknown substance
  • 1890’s, unknown nuclear substance named DNA
  • Walter Sutton (1902) discovered DNA in chromosomes
  • Fredrick Griffith (1928) working with Streptococcus pneumoniae conducted transformation experiments of virulent & nonvirulent bacterial strains
  • Levene (1920’s) determined 3 parts of a nucleotide
  • Hershey & Chase (1952) used bacteriophages (viruses) to show that DNA, not protein, was the cell’s hereditary material
  • Rosalind Franklin (early 1950’s) used x-rays to photograph DNA crystals


Click for larger picture!


  • Erwin Chargraff (1950’s) determined that the amount of A=T and amount of C=G in DNA; called Chargaff’s Rule
  • Watson & Crick discovered double helix shape of DNA & built the 1st model

Click for larger picture!

 DNA Replication

  •  Process by which DNA makes a copy of itself
  • Occurs during S phase of interphase before cell division
  • Extremely rapid and accurate (only 1 in a billion are incorrectly paired)
  • Requires many enzymes & ATP (energy)
  • Begins at special sites along DNA called origins of replication where 2 strands open & separate making  a replication fork


  • Nucleotides added & new strand forms at replication forks
  • DNA helicase (enzyme) uncoils & breaks the weak hydrogen bonds between complementary bases (strands separate)
  •  DNA polymerase adds new nucleotides to the exposed bases in the 5’ to 3’ direction

  •  Leading strand (built toward replication fork) completed in one piece
  • Lagging strand (built moving away from the replication fork) is made in sections called Okazaki fragments


OKAZAKI FRAGMENTS

  •  DNA ligase helps join Okazaki segments together

  • DNA polymerase proofreads the new DNA checking for errors & repairing them; called excision repair
  • Helicase recoils the two, new identical DNA molecules

RNA

  • Ribonucleic acid
  • Single stranded molecule  

  • Found in nucleus & cytoplasm
  • Contains ribose sugar
  • Contains the nitrogen base uracil (U) instead of thymine so A pairs with U
  • Base pairings are A-U and C-G
  • Three types of RNA exist (mRNA, TRNA, & rRNA)

mRNA

  • Messenger RNA
  • Single, uncoiled, straight strand of nucleic acid
  • Found in the nucleus & cytoplasm
  • Copies DNA’s instructions & carries them to the ribosomes where proteins can be made
  • mRNA’s base sequence is translated into the amino acid sequence of a protein
  • Three consecutive bases on mRNA called a codon (e.g. UAA, CGC, AGU)
  • Reusable

tRNA

  • Transfer RNA
  • Single stranded molecule containing 80 nucleotides in the shape of a cloverleaf
  • Carries amino acids in the cytoplasm to ribosomes for protein assembly
  • Three bases on tRNA that are complementary to a codon on mRNA are called anticodons (e.g. codon- UUA; anticodon- AAU)
  • Amino Acid attachment site across from anticodon site on tRNA
  • Enters a ribosome & reads mRNA codons and links together correct sequence of amino acids to make a protein
  • Reusable  

rRNA

  • Ribosomal RNA
  • Globular shape
  • Helps make up the structure of the ribosomes  
  • rRNA & protein make up the large & small subunits of ribosomes
  • Ribosomes are the site of translation (making polypeptides)

  • Aids in moving ribosomes along the mRNA strand as amino acids are linked together to make a protein

Amino Acids

  • 20 exist
  • Linked together in a process called protein synthesis in the cytoplasm to make polypeptides (subunits of proteins)
  • DNA contains the instructions for making proteins but is too large to leave the nucleus
  • Three consecutive bases on DNA called a triplet (e.g. TCG, ATG, ATT)
  • mRNA codon table tells what 3 bases on mRNA code for each amino acid (64 combinations of 3 bases)
  • Methionine (AUG) on mRNA is called the start codon because it triggers the linking of amino acids
  • UAA, UGA,  & UAG on mRNA signal ribosomes to stop linking amino acids together

Genetic Code (RNA)


 Amino Acid  3 Letter
Abbreviation
 Codons
 Alanine  Ala  GCA GCC GCG GCU
 Arginine  Arg  AGA AGG CGA CGC CGG CGU
 Aspartic Acid  Asp  GAC GAU
 Asparagine  Asn  AAC AAU
 Cysteine  Cys  UGC UGU
 Glutamic Acid  Glu  GAA GAG
 Glutamine  Gln  CAA CAG
 Glycine  Gly  GGA GGC GGG GGU
 Histidine  His  CAC CAU
 Isoleucine  Ile  AUA AUC AUU
 Leucine  Leu  UUA UUG CUA CUC CUG CUU
 Lysine  Lys  AAA AAG
 Methionine  Met  AUG
 Phenylalanine  Phe  UUC UUU
 Proline  Pro  CCA CCC CCG CCU
 Serine  Ser  AGC AGU UCA UCC UCG UCU
 Threonine  Thr  ACA ACC ACG ACU
 Tryptophan  Trp  UGG
 Tyrosine  Tyr  UAC UAU
 Valine  Val  GUA GUC GUG GUU
 Start  AUG
 Stop  UAA UAG UGA


  Practice Table:

DNA
Codon
mRNA
Codon
tRNA
Anticodon
Amino
Acid

GCU

TAC    
    AUU
  UUU  
TCA    
    UCU
CTT    
  ACU
ACU  

Protein Synthesis

  • Consists of 2 parts — Transcription & Translation
  • Begins in the nucleus with mRNA copying DNA’s instructions for proteins (transcription)
  • Completed in the cytoplasm when tRNA enters ribosomes to read mRNA codons and link together amino acids (translation)

 Steps in Transcription

  1. DNA helicase (enzyme) uncoils the DNA molecule
  2. RNA polymerase  (enzyme) binds to a region of DNA called the promoter which has the start codon TAC to code for the amino acid methionine
  3. Promoters mark the beginning of a DNA chain in prokaryotes, but mark the beginning of 1 to several related genes in eukaryotes
  4. The 2 DNA strands separate, but only one will serve as the template & be copied
  5. Free nucleotides are joined to the template by RNA polymerase in the 5’ to 3’ direction to form the mRNA strand
  6. mRNA sequence is built until the enzyme reaches an area on DNA called the termination signal
  7. RNA polymerase breaks loose from DNA and the newly made mRNA
  8. Eukaryotic mRNA is modified (unneeded sections snipped out by enzymes & rejoined) before leaving the nucleus through nuclear pores, but prokaryotic RNA isn’t
  9. All 3 types of RNA called transcripts are produced by this method

Steps in Translation

  1. mRNA brings the copied DNA code from the nucleus to the cytoplasm
  2. mRNA attaches to one end of a ribosome; called initiation
  3. tRNA’s attach the correct amino acid floating in the cytoplasm to themselves
  4. tRNA with its attached amino acid have 2 binding sites where they join the ribosome
  5. The tRNA anticodon “reads” & temporarily attaches to the mRNA codon in the ribosome
  6. Two amino acids at a time are linked together by peptide bonds to make polypeptide -chains (protein subunits); called elongation
  7. Ribosomes) move along the mRNA strand until they reach a stop codon (UAA, UGA, or UAG); called termination

  1. tRNA’s break loose from amino acid, leave the ribosome, & return to cytoplasm to pick up another amino acid

Click here for an animation of Translation 

BACK


Natural Selection Activity


Survival of the Fittest


Introduction:

  Within a population, organisms will vary.  Charles Darwin stated that in the struggle for existence, those variant organisms that have favorable variations are “better adapted” to their environment and will survive and reproduce in greater numbers.  Favorable variations may mean that they are faster, or stronger, or able to eat different types of food, or better camouflaged to avoid predators.  In this lab you will simulate the effect of predation by a hawk on a large population of assorted mice.  Your population of mice will consist of black, white, and speckled mice.  You will represent the hawk.

Objectives:

 to simulate the effect of hawk predation on the appearance of mice
-to simulate the natural selection of traits

Materials:

large sheet of newspaper  4 hawks (students)
30 white mice (paper squares) 1 petri dish
30 speckled mice (paper squares)
30 black mice (paper squares)

Procedure:

  1. Open your sheet of newspaper and place it on the lab table.  This will serve as the environment for your mice.
  2. Place the petri dish on the other side of the lab table.  This will be the nest.
  3. Select one person from your group to act as a hawk.  This person should stand by the nest.
  4. Spread the mice on their environment evenly.
  5. The hawk now swoops over and has 1 minute to pick up as many mice as possible. The hawk may only pick up one mouse at a time, and must place it in their nest (a petri dish) before flying back to pick up another.  The goal is to pick up as many mice as possible in the time period.
  6. When the time is up record the number of mice left in the environment in the data table below.
  7. Repeat this procedure for each person in the lab group or 4 times. 
  8. After all data is collected, construct a bar graph. Be sure to label the graph and its axes.
  9. Data:


White
mice
Speckled mice
Black
mice
Hawk #1  


Hawk #2  


Hawk #3  


Hawk #4  


Total  


Conclusion:
 Write a paragraph describing;

* the purpose of the lab

* what you thought the results would be

* what the results were (discussing numbers from data)

*how the mouse population and hawk population may change over time from natural selection