| Mendelian Genetics All Materials © Cmassengale |
 |
 |
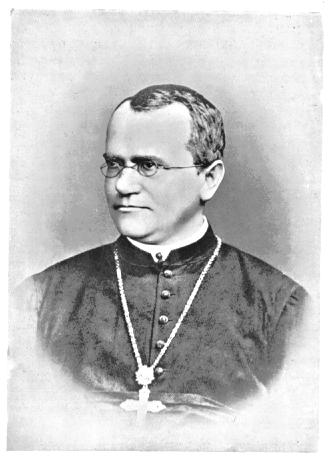 |
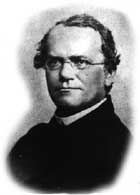
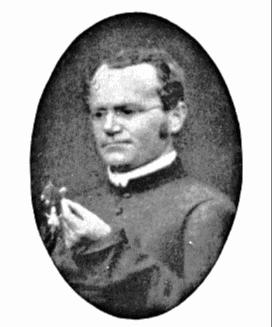
| 1862 | 1868 | 1880 |
Genetic Terminology:
- Trait – any characteristic that can be passed from parent to offspring
- Heredity – passing of traits from parent to offspring
- Genetics – study of heredity
- Alleles – two forms of a gene (dominant & recessive)
- Dominant – stronger of two genes expressed in the hybrid; represented by a capital letter (R)
- Recessive – gene that shows up less often in a cross; represented by a lowercase letter (r)
- Genotype – gene combination for a trait (e.g. RR, Rr, rr)
- Phenotype – the physical feature resulting from a genotype (e.g. tall, short)
- Homozygous genotype – gene combination involving 2 dominant or 2 recessive genes (e.g. RR or rr); also called pure
- Heterozygous genotype – gene combination of one dominant & one recessive allele (e.g. Rr); also called hybrid
- Monohybrid cross – cross involving a single trait
- Dihybrid cross – cross involving two traits
- Punnett Square – used to solve genetics problems
Blending Concept of Inheritance:
- Accepted before Mendel’s experiments
- Theory stated that offspring would have traits intermediate between those of its parents such as red & white flowers producing pink
- The appearance of red or white flowers again was consider instability in genetic material
- Blending theory was of no help to Charles Darwin’s theory of evolution
- Blending theory did not account for variation and could not explain species diversity
- Particulate theory of Inheritance, proposed by Mendel, accounted for variation in a population generation after generation
- Mendel’s work was unrecognized until 1900
Gregor Mendel:
- Austrian monk
- Studied science & math at the University of Vienna
- Formulated the laws of heredity in the early 1860’s
- Did a statistical study of traits in garden peas over an eight year period
 |
Why peas, Pisum sativum?
- Can be grown in a small area
- Produce lots of offspring
- Produce pure plants when allowed to self-pollinate several generations
- Can be artificially cross-pollinate
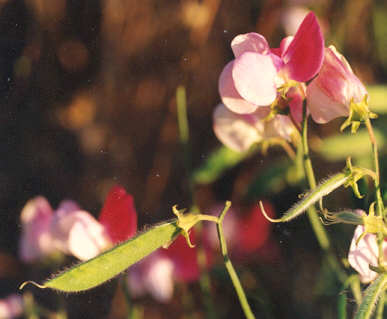
GARDEN PEA
Mendel’s Experiments:
- Mendel studied simple traits from 22 varieties of pea plants (seed color & shape, pod color & shape, etc.)
- Mendel traced the inheritance of individual traits & kept careful records of numbers of offspring
- He used his math principles of probability to interpret results
- Mendel studied pea traits, each of which had a dominant & a recessive form (alleles)
- The dominant (shows up most often) gene or allele is represented with a capital letter, & the recessive gene with a lower case of that same letter (e.g. B, b)
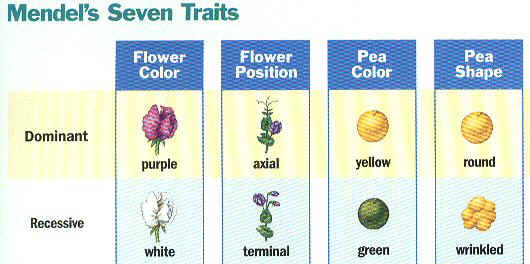
- Mendel’s traits included:
a. Seed shape — Round (R) or Wrinkled (r)
b. Seed Color —- Yellow (Y) or Green (y)
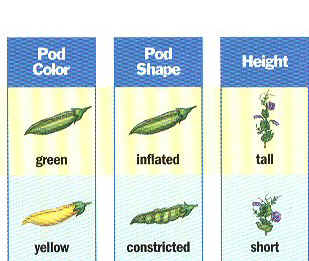
c. Pod Shape — Smooth (S) or wrinkled (s)
d. Pod Color — Green (G) or Yellow (g)
e. Seed Coat Color — Gray (G) or White (g)
f. Flower position — Axial (A) or Terminal (a)
g. Plant Height — Tall (T) or Short (t)
h. Flower color — Purple (P) or white (p)
- Mendel produced pure strains by allowing the plants to self-pollinate for several generations
- These strains were called the Parental generation or P1 strain
- Mendel cross-pollinated two strains and tracked each trait through two
generations (e.g. TT x tt )Trait – plant height
Alleles – T tall, t short
P1 cross TT x tt
genotype — Tt t t phenotype — Tall T Tt Tt genotypic ratio –all alike T Tt Tt phenotypic ratio- all alike
- The offspring of this cross were all hybrids showing only the dominant trait & were called the First Filial or F1 generation
- Mendel then crossed two of his F1 plants and tracked their traits; known as an F1 cross
Trait – plant height |
||||
|
Alleles – T tall, t short |
||||
|
F1 cross Tt x Tt |
genotype — TT, Tt, tt | |||
| T | t | phenotype — Tall & short | ||
| T | TT | Tt | genotypic ratio —1:2:1 | |
| t | Tt | tt | phenotypic ratio- 3:1 | |
- When 2 hybrids were crossed, 75% (3/4) of the offspring showed the dominant trait & 25% (1/4) showed the recessive trait; always a 3:1 ratio
- The offspring of this cross were called the F2 generation
- Mendel then crossed a pure & a hybrid from his F2 generation; known as an F2 or test cross
| Trait – Plant Height | |||||||
| Alleles – T tall, t short | |||||||
|
F2 cross TT x Tt |
F2 cross tt x Tt |
||||||
| T | t | T | t | ||||
| T | TT | Tt | t | Tt | tt | ||
| T | TT | Tt | t | Tt | tt | ||
| genotype – TT, Tt | genotype – tt, Tt | ||||||
| phenotype – Tall | phenotype – Tall & short | ||||||
| genotypic ratio – 1:1 | genotypic ratio – 1:1 | ||||||
| phenotypic ratio – all alike | phenotypic ratio – 1:1 | ||||||
- 50% (1/2) of the offspring in a test cross showed the same genotype of one parent & the other 50% showed the genotype of the other parent; always a 1:1 ratio
Problems: Work the P1, F1, and both F2 crosses for all of the other pea plant traits & be sure to include genotypes, phenotypes, genotypic & phenotypic ratios.
- Mendel also crossed plants that differed in two characteristics (Dihybrid Crosses)
such as seed shape & seed color - In the P1 cross, RRYY x rryy, all of the F1 offspring showed only the dominant form for both traits; all hybrids, RrYy
|
Traits: Seed Shape & Seed Color |
||||
|
Alleles: R round Y yellow |
||||
|
P1 Cross:
|
||||
| ry | Genotype: | RrYy | ||
| RY | RrYy |
Phenotype: | Round yellow seed | |
| Genotypic ratio: | All alike | |||
| Phenotypic ratio: | All Alike | |||
- When Mendel crossed 2 hybrid plants (F1 cross), he got the following results
|
Traits: Seed Shape & Seed Color |
||||
|
Alleles: R round Y yellow |
||||
| F1 Cross: RrYy x RrYy | ||||
| RY | Ry | rY | ry | |
| RY | RRYY |
RRYy |
RrYY |
RrYy |
| Ry | RRYy |
RRyy |
RrYy |
Rryy |
| rY | RrYY |
RrYy |
r rYY |
r rYy |
| ry | RrYy |
Rryy |
r rYy |
r ryy |
| Genotypes | Genotypic Ratios | Phenotypes | Phenotypic Ratios |
| RRYY | 1 | Round yellow seed |
9 |
| RRYy | 2 | ||
| RrYY | 2 | ||
| RrYy | 4 | ||
| RRyy | 1 | Round green seed |
3 |
| Rryy | 2 | ||
| r rYY | 1 | Wrinkled yellow seed |
3 |
| r rYy | 2 | ||
| r ryy | 1 | Wrinkled green seed |
1 |
Problems: Choose two other pea plant traits and work the P1 and F1 dihybrid crosses. Be sure to show the trait, alleles, genotypes, phenotypes, and all ratios.
Results of Mendel’s Experiments:
- Inheritable factors or genes are responsible for all heritable characteristics
- Phenotype is based on Genotype
- Each trait is based on two genes, one from the mother and the other from the father
- True-breeding individuals are homozygous ( both alleles) are the same
- Law of Dominance states that when different alleles for a characteristic are inherited (heterozygous), the trait of only one (the dominant one) will be expressed. The recessive trait’s phenotype only appears in true-breeding (homozygous) individuals
| Trait: Pod Color | |
| Genotypes: | Phenotype: |
| GG | Green Pod |
| Gg | Green Pod |
| gg | Yellow Pod |
- Law of Segregation states that each genetic trait is produced by a pair of alleles which separate (segregate) during reproduction
| Rr | |
| R | r |
- Law of Independent Assortment states that each factor (gene) is distributed (assorted) randomly and independently of one another in the formation of gametes
|
RrYy |
|||
| RY | Ry | rY | ry |
Other Patterns of Inheritance:
- Incomplete dominance occurs in the heterozygous or hybrid genotype where the 2 alleles blend to give a different phenotype
- Flower color in snapdragons shows incomplete dominance whenever a red flower is crossed with a white flower to produce pink flowers
- In some populations, multiple alleles (3 or more) may determine a trait such as in ABO Blood type
- Alleles A & B are dominant, while O is recessive
| Genotype | Phenotype |
| IOIO | Type O |
| IAIO | Type A |
| IAIA | Type A |
| IBIO | Type B |
| IBIB | Type B |
| IAIB | Type AB |
- Polygenic inheritance occurs whenever many variations in the resulting phenotypes such as in hair, skin, & eye color
- The expression of a gene is also influenced by environmental factors (example: seasonal change in fur color)