Great Biology Web Sites


Great Biology Web Sites


Great Sites by Great Teachers
These are some of the best web sites that I have found.  These are awesome teachers making a difference.   If you can add to the list, please send me an email at: cmassengale8@sps.k12.ar.us
Kelly Reidell  http://kr021.k12.sd.us/
Mark Adame http://smtexas.net/faculty/adame/BIOLOGYHOME.htm
Diane Goerlitz         


Biology.org

J. Naughton’s Biology Page http://www.niles-hs.k12.il.us/jacnau/

Shannan Muskopf       Biology Corner          http://www.biologycorner.com/

Biologyzone-
Kim B. Foglia

Genetic Traits Activity


Finding Your Genetic Match

Introduction:

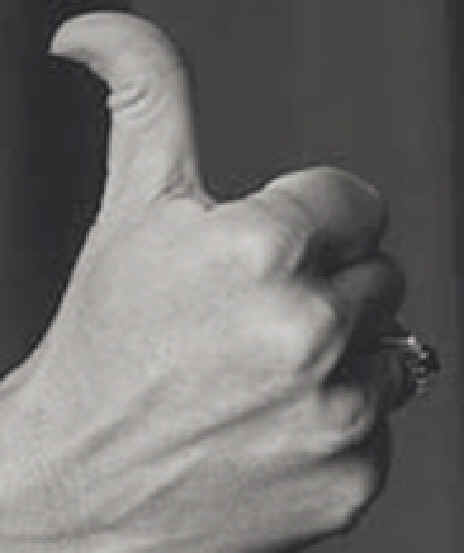
Have you ever noticed that brothers or sisters often look alike?  Their inherited traits are what make their physical appearance so similar. An inherited trait is a particular genetically determined characteristic that distinguishes a person. The traits of children are determined by the traits that  are passed on from their parents. Some traits are obvious in a family — a child’s nose is shaped like their mother’s nose, but some traits are less obvious. You may have similar traits to many of your classmates even though you are not related to them. Some examples of often un-noticed human traits are the ability or not to roll your tongue, attached or unattached earlobes, dimples or freckles, naturally curly or straight hair, hitchhiker’s or straight thumb, straight or widow’s peak hairline, smooth or cleft chin, or colorblindness or normal vision.

There are numerous traits in humans, but some traits occur more frequently than others.  Between 70-90% of the human population have free-hanging earlobes, can roll their tongue,  are right-handed, and can taste a chemical called PTC.  These traits are called high frequency traits.

Objective:

Students will determine the presence of certain high frequency traits in themselves & their classmates.

Materials:

Genetic Inventory sheet with pictures, paper, pencil, PTC taste strips.

Procedure:

  1. Identify which of the following 10 human traits you have by placing a check mark beside that trait.
  2. Compare the traits you have with other students in the classroom and find the student you most closely match.


Human Trait Inventory
Student:
Tongue Roller
Non-Tongue Roller
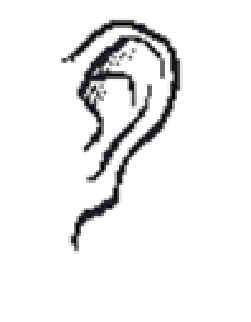
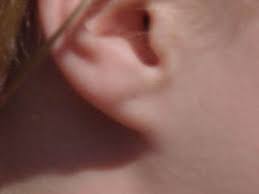
Attached Earlobes
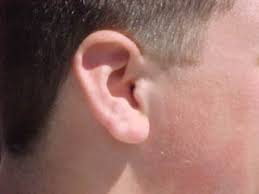
Unattached earlobes
Dimples
No Dimples
Right-handed
Left-Handed
Widow’s Peak
Straight Hairline
Left Thumb on top when Hands Crossed
Right Thumb on top when Hands Crossed
Hair on mid-digit of hand
No hair on mid-digit of hand
Bent little finger
Straight little finger
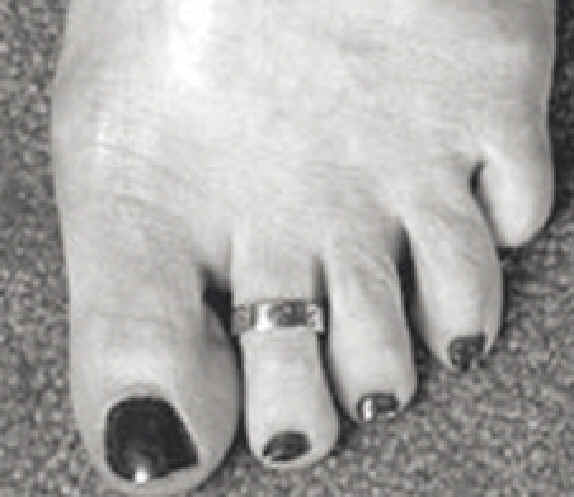
Second toe longer than big toe
Second toe not longer than big toe
Can Taste PTC
Can Not Taste PTC
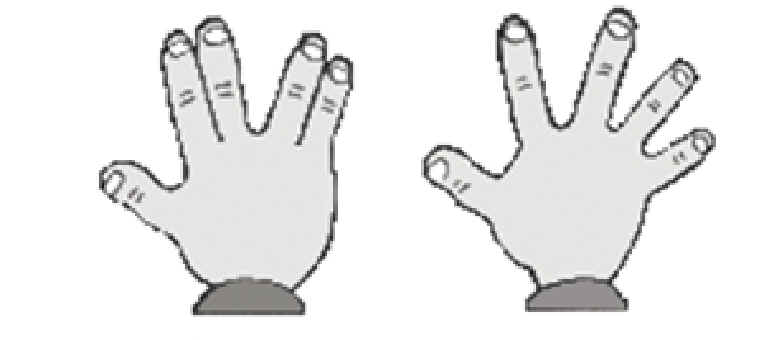
Vulcan (Fingers spread 2 by 2)
None Vulcan
Class Match:


Tongue Roller Non Roller Dimples No Dimples
Attached Earlobes Unattached Earlobes Widow’s Peak Straight Hairline
Longer Second Toe Short Second Toe Bent Little finger Hitchhiker’s Thumb
Attached Ear lobes (left)
Unattached ear Lobes (right)
“VULCAN” or No “VULCAN” Dimples Right/Left Thumb on top


Enzyme Catalysis


Enzyme Catalysis

Introduction:
In general, enzymes are proteins produced by living cells, they act as catalysts in biochemical reactions. A catalyst affects the rate of a chemical reaction. One consequence of enzyme activity is that cells can carry out complex chemical activities at relative low temperatures. In an enzyme-catalyzed reaction, the substance to be acted upon ( the substrate = S ) binds reversibly to the active site of the enzyme (E). One result of this temporary union is a reduction in the energy required to activate the reaction of the substrate molecule so that the products (P) of the reaction are formed.

In summary:     E + S —> ES –> E + P

Note that the enzyme is not changed in the reaction and can even be recycled to break down additional substrate molecules. Each enzyme is specific for a particular reaction because its amino acid sequence is unique and causes it top have a unique three-dimensional structure. The active site is the portion of the enzyme that interacts with the substrate, so that any substance that blocks or changes the shape of the active site affects the activity of the enzyme. A description of several ways enzyme action may be affected follows:

1. Salt Concentration. If the salt concentration is close to zero, the charged amino acid side chains of the enzyme molecules will attract to each other. The enzyme will denature and form an inactive precipitate. If, on the other hand, the salt concentration is too high, normal interaction of charged groups will be blocked, new interactions will occur, and again the enzyme will precipitate. An intermediate salt concentration such as that of human blood (0.9% ) or cytoplasm ins the optimum for many enzymes.

2. pH. Amino acid side chains contain groups such as – COOH and NH2 that readily gain or lose H+ ions. As the pH is lowered an enzyme will tend to gain H+ ions, and eventually enough side chains will be affected so the enzyme’s shape is disrupted. Likewise, as the pH is raised, the enzymes will lose H+ ions and eventually lose its active shape. Many of the enzymes function properly in the neutral pH range and are denatured at either an extremely high or low pH. Some enzymes, such as pepsin, which acts in the human stomach where the pH is very low, have a low pH optimum.

3. Temperature. Generally, chemical reactions speed up as the temperature is raised. As the temperature increases, more of the reacting molecules have enough kinetic energy to undergo the reaction. Since enzymes are catalysts for chemical reactions, enzyme reactions also tend to go faster with increase temperature. However, if the temperature of an enzyme-catalyzed reaction is raised still further, a temperature optimum is reached; above this value the kinetic energy of the enzyme and water molecules is so great that the conformation of the enzyme molecules is disrupted. The positive effect of speeding up the reaction is now more than offset by the negative effect of changing the conformation of more and more enzyme molecules. Many proteins are denatured by temperatures around 40-50 degrees C, but some are still active at 70-80 degrees C, and a few even withstand boiling.

4. Activation’s and Inhibitors. Many molecules other than the substrate may interact with an enzyme. If such a molecule increases the rate of the reaction it is an activator, or if it decreases the reaction rate it is an inhibitor. These molecules can regulate how fast the enzymes acts. Any substance that tends to unfold the enzyme, such as an organic solvent or detergent, will act as an inhibitor. Some inhibitors act by reducing the -S-S- bridges that stabilize the enzyme’s structure. Many inhibitors act by reacting with the side chains in or near the active site to change its shape or block it. Many well known poisons such as potassium-cyanide and curare are enzyme inhibitors that interfere with the active site of critical enzymes.

The enzyme used in this lab, catalase, has four polypeptide chains, each composed of more than 500 amino acids. This enzyme is ubiquitous in aerobic organisms. One function of catalase within cells is to prevent the accumulation of toxic levels of hydrogen peroxide formed as a by-product of metabolic processes. Catalase might also take part in some of the many oxidation reactions that occur in the cell.

2H2O ——-> 2 H2O + O2 (gas )

In the absence of catalase, this reaction occurs spontaneously, but very slowly. Catalase speeds up the reaction considerably. In this experiment, a rate for this reaction will be determined. Much can be learned about enzymes by studying the kinetics of enzyme-catalyzed reactions. For example, it is possible to measure the amount of product formed, or the amount of substrate used, from the moment the reactants are brought together until the reaction has stopped. If the amount of product formed is measured at regular intervals and this quantity is plotted on a graph, a curve like the one that follows is obtained.

Figure 2.1 Enzyme Activity

Study the solid line of the graph of this reaction. At time 0 there is no product. As time progresses the production of product increases at a steady rate. After a period of time this rate slows down and at a certain point the reaction rate is very slow.

General Procedure:
In this experiment the disappearance of the substrate, H2O2, is measured as follows:

1. A purified catalase extract is mixed with substrate ( H2O2) in a beaker. The enzyme catalyzes the conversion of H2O to H2O and O2 (gas ).

2. Before all the H2O2 is converted to H2O and O2 , the reaction is stopped by adding sulfuric acid ( H2SO4 ). The sulfuric acid lowers the pH, denatures the enzyme, and thereby stops the enzyme’s catalytic activity.

3. After the reaction is stopped, the amount of substrate (H2O2) remaining in the beaker is measured. To measure this quantity, potassium permanganate is used. Potassium permanganate (KMnO4), in the presence of H2O2 and H2SO4 reacts as follows:

5 H2O2 + 2 KMnO4 + 3 H2SO4 ————–> K2SO4 + 2 MnSO4 + 8 H2O + 5 O2

Note that H2O2 is a reactant for this reaction. Once all the H2O2 has reacted, any more KMnO4 added will be in excess and will not be decomposed. The addition of excess KMnO4 causes the solution to have a permanent pink or brown color. Therefore, the amount of H2O2 remaining is determined by adding KMnO4, until the whole mixture stays a faint pink or brown, permanently. Add no more KMnO4 after this point.

Figure 2.2 The General Procedure for the above exercise and Exercise 2C.
The figure below represents the complete Exercise 2C.

Exercise 2A: Test of Catalase Activity:
1. To observe the reaction to be studied, transfer 10 mL of 1.5% (0.44M) H2O2 into a 50 ml glass beaker and add 1 mL of freshly made catalase solution. The bubbles coming from the reaction mixture are oxygen, which results from the breakdown of H2O2 by catalase. Be sure to keep the freshly made catalase solution on ice at all times.

a. what is the enzyme in this reaction? ____________________________________________________

b. What is the substrate in this reaction? ___________________________________________________

c. What is the product in this reaction? ____________________________________________________

d. How could you show that the gas evolved is oxygen ? _____________________________________

2. To demonstrate the effect of boiling on enzymatic activity, transfer 5 mL of purified catalase extract to a test tube and place it in a boiling water bath for five minutes. Transfer 10 mL of 1.5% H2O2 into a 50 mL glass beaker and add 1 mL of the cooked, boiled catalase solution. How does the reaction compare to the one using the unboiled catalase? Explain the reason for this difference.

_____________________________________________________________________

_____________________________________________________________________

3. To demonstrate the presence of catalase in living tissue, cut 1 cm3 of potato or liver, macerate it, and transfer it into a 50 mL beaker containing 1.5% H2O2 . What do you observe? What do you think would happen if the potato or liver was boiled before being added to the H2O2?

_____________________________________________________________________

_____________________________________________________________________

Exercise 2B: The Baseline Assay:
To determine the amount of H2O2 initially present in a 1.5% solution, one needs to perform all the steps of the procedure without adding catalase to the reaction mixture. This amount is known as the baseline and is an index of the initial concentration of H2O2 un solution. In any series of experiments, a baseline should be established first.

Procedure for Establishing Baseline:
1. Put 10 mL of 1.5% H2O2 into a clean glass beaker.

2. Add 1 mL of H2O ( instead of enzyme solution).

3. Add 10 mL of H2SO4 (1.0 M) Use Extreme care in Handling Acids.

4. Mix well.

5. Remove a 5 mL sample. Place this 5 mL sample in another beaker, and assay for the amount of H2O2 as follows: Place the beaker containing the sample over white paper. Use a burette or 5 mL pipette to add potassium permanganate a drop at a time to the solution until a persistent pink or brown color is obtained. Remember to gently swirl the solution after adding each drop. Record your data below.

Baseline calculations

Final Reading of burette ________ mL

Initial reading of burette ________mL

Baseline (Final -Initial) _________mL KMnO4

Figure 2.4: Proper Reading of a Burette


Exercise 2C: An Enzyme-Catalyzed Rate of H2O2 Decomposition

Refer to figure 2.2 to complete this section and record the data in Table 2.1 below.

Table 2.1

Potassium Permanganate (ml)

Time (Seconds)

10 30 60 120 180 360
A. Baseline
B. Final Reading
C. Initial Reading
D. Amount of KMnO4 consumed (B-C)
E. Amount of H2O2 used (A-D)

Graph the data for enzyme-catalyzed H2O2 decomposition.

Graph Title: ___________________________________________________________________


Graph 2.1

Analysis of Results:
1. Explain the inhibiting effect of sulfuric acid on the function of catalase. Relate this to enzyme structure and chemistry.

____________________________________________________________________

____________________________________________________________________

____________________________________________________________________

2. Predict the effect lowering the temperature would have on the rate of enzyme activity. Explain you prediction.

____________________________________________________________________

____________________________________________________________________

____________________________________________________________________
3. Design a controlled experiment to test the effect of varying pH, temperature, or enzyme concentration.

____________________________________________________________________

____________________________________________________________________
____________________________________________________________________

____________________________________________________________________

____________________________________________________________________

____________________________________________________________________
AP LAB PAGE


Fimbriae Article

Fimbriae, Fibrils, Sex and Fuzzy Coats


The Limitation of Light

One of the frustrating aspects of working with bacteria is that they are so small that it is almost impossible to see anything other than their shape when looking down even the very best of optical microscopes. Even then, their refractive index is so similar to that of water that they have to be stuck to a glass slide, killed and stained before even their shape is revealed. Microscopes which can make use of polarized light (Phase contrast microscopy) can be used to see living bacteria but apart from the added ability of seeing some species happily swimming around they add little to what we can see using conventional staining techniques.

The fact that some species could move quite rapidly intrigued many early microbiologists and eventually some special staining procedures lead to the discovery of thin whip-like appendages which they called flagellae and conferred motility.  This is not to say that light microscopy is not useful. It remains an essential tool in any bacteriology laboratory but it should be recognized that the information obtained, although extremely helpful in routine work, is limited.

Electron Microscopy Reveals More

The invention of the electron microscope revealed much more detail of bacteria. Compared to the fascinating structures uncovered in eukaryotic cells, bacteria, both inside and out, were pretty uninteresting.  It wasn’t until the early 1960s that some interesting surface features of some bacterial species were noticed. This delay was partly due to the electron microscopy techniques in use at that time. The convention at the time was to use ultra-thin sections of tissue, far thinner than sections used for light microscopy. It seemed normal then to prepare bacteria in the same way. Using these techniques, the outer surfaces of bacteria seemed fairly barren but the technique did reveal some of the double membrane-like composition of Gram-negative bacteria.

Shadow-Casting Reveals Still More

Although thin sections of bacteria did not allow flagella to be seen in their entirety it did reveal interesting cross-sections which showed their internal structure. It also enabled detail of flagella attachment to be demonstrated.  It was not until electron microscopes were used to look at whole cells rather than ultra-thin sections that more progress was made. This change required the development of new staining techniques known as shadow-casting where bacterial surfaces were sprayed with electron-dense material such as gold or carbon at an angle. This highlighted the fine surface structures in a way exactly analogous to light falling on a stone surface at an angle reveals more detail than light falling on it at right angles.

Shadows, Flagellae and Fimbriae

Once shadow-casting techniques had been developed the whip-like flagellae were the first to be examined in detail but one researcher in particular noticed the presence of previously undreamed of structures on the surface of some species.  The person who first described these structures which he found on strains of Escherichia coli and Salmonella was Professor James Duguid. He called them fimbriae.

What are Fimbriae?

Fimbriae are thin, hair-like, projections made of protein sub-units. A number of different types have been described (about 7 at the last count, labeled Types I-VII) which can be distinguished by their size (length and diameter) and the type of antigens they carry.  They are characteristic of some Gram-negative bacteria such as Escherichia coli and Salmonella spp and were first described back in the 1960s by JP Duguid who was the Professor of Microbiology at the University of Dundee . Later, it was discovered that these fimbriae would re-grow after they had been broken off e.g. by vigorous shaking and that this re-growth was from pre-formed protein sub-units which were stored inside the cells. Fimbriae originate in the cytoplasm of the cell and project through the cell membrane and the cell wall.


A Controversy
A short while after Duguid published his findings an American called Robert Brinton published much the same stuff and called them pili. What followed was a pretty acrimonious exchange of letters in the scientific press about what they should be called.

It was all pretty good fun but to this day our American cousins, and anybody who doesn’t know any better, call them pili whereas all right-thinking, clear-minded and fair microbiologists refer to them as fimbriae.


So What do Fimbriae Actually do?

Over the years we have learned quite a lot about fimbriae and right from the very early days it was thought that they were involved in helping the bacteria adhere to surfaces. There is now a substantial body of evidence in support of this much of it in relation to pathogenic strains of E coli.

Type I Fimbriae are Pathogenicity Factors

It’s clear these days that Type I fimbriae are involved in bacterial adhesion and the very best example are those carried by pathogenic strains of E.coli. These come in a variety of forms including plain old EnteroPathogenic E.coli (EPEC), EnteroToxigenic E.coli (ETEC), EnteroInvasive E.coli (EIEC) and VeroToxogenic E.coli (VTEC). These E.coli strains use Type I fimbriae to adhere to gut mucosal cells which is the first step in the pathogenic process. Without the fimbriae their capacity to cause disease is greatly diminished or abolished completely.

Type IV fimbriae are particularly interesting. These have also been referred to as “bundle forming pili” because of their ability to aggregate into bundles. These fimbriae are thought to be connected with the ability of EPEC strains to form microcolonies on tissue monolayers and mutants lacking this ability show reduced virulence. Type IV fimbriae have also been shown to be involved in the remarkable phenomenon of bacterial twitching motility which allows bacterial cells to crawl over a surface.

Type VII Fimbriae, Viruses and the Sex Bit

Type VII fimbriae are the conduit for DNA transfer between bacterial mating strains. As it happens they also provide a binding site for certain bacteriophages. The significance of this is a mystery but it does enable Type VII to be seen clearly because when some of the bacteriophage is added to a suspension of cells, the ‘phage coat the Type VII fimbriae.  In the electron microscope picture above right you can clearly see little particles stuck on two of the fimbriae which are much longer than the rest because size does matter, at least to E.coli. In a generous attempt to resolve the fimbriae/pili argument it was proposed that Type VII fimbriae were named the “sex pilus”.


 Sex Pili
The photograph above was taken using a transmission electron microscope. The Type I fimbriae are the thin projections sticking out from the surface of the cell. Some of the fimbriae have broken off indicating that they are quite brittle.


Surfaces of Streptococci

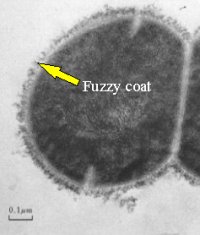
Back in the days before we knew much about fimbriae researchers looking at ultra-thin sections of the serious pathogen Streptococcus pyogenes noticed that the very outside of the cells had a fuzzy appearance. In a fit of imagination it was called “fuzzy coat”.  Later, when they learned about shadow-casting whole cells they applied this technique but it did not help to resolve any particular structures like fimbriae.


S. pyogenes Fuzzy Coat
Even today we have not resolved any definite structure to the S. pyogenes “fuzzy-coat”. We do know, however, that it consists partly of a substance called “M-protein” which is a major pathogenicity factor of this species.


Negative Staining Reveals Surface Fibrils on Some Streptococci

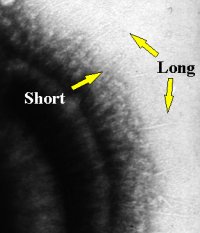
Towards the late 1970s a rather different technique which made use of a special type of stain called a “negative stain” revealed very thin, delicate, hair-like structures on some oral streptococci such as Streptococcus sanguis and Streptococcus salivarius. Take a look at the photograph on the right. This is an electron micrograph of the surface of a Streptococcus salivarius cell and although it may not be terribly clear on this reproduction, the original shots showed two types of these thin hair-like structures, long ones and short ones.  This negative-staining technique could not, by the way, reveal anything hair-like on the surface of Streptococcus pyogenes which had the fuzzy coat.

Fibrils are not Fimbriae

More research using lots of different strains of different species of oral streptococci showed these “hairs” came in all sorts of lengths and some cells carried more than one type. They were very thin and flexible. Although some fimbriae on E.coli can be very thin, “flexible” is not a term normally associated with fimbriae.  To begin with these hairs were called “fibrils” and there is a fair amount of evidence to suggest they are made of protein and some evidence which suggests that some are even made of glycoprotein although glycoproteins are generally considered pretty rare beasts in bacteria. As far as fibril synthesis goes, we don’t know much. Generally speaking they are difficult to remove, probably because they are so flexible, so it’s not possible to say whether they can re-grow like fimbriae.  The analogy was taken a stage further when a role in adhesion was postulated and, in fact, there is fairly good evidence to back this up, at least for the S.salivarius fibrils.

Unfortunately at this point the waters got a bit muddy when some people started referring to the long fibrils as “fimbriae” and the short ones as “fibrils”. Since they are kind of like fimbriae this wasn’t so surprising but what was surprising was that they were never referred to as pili!


Streptococcal Fibrils
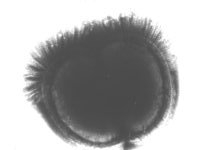
Some Oral Streptococci Have Tufts of Fibrils
Some strains of oral streptococci were found to carry tufts of fibrils and looked rather like punk-rockers with Mohican hairstyles. Later these were grouped together into a new species and given the rather elegant name Streptococcus cristae.


Fibril Tufts and Co-aggregation

There is evidence that these may also be involved in adhesion, this time to rod-shaped bacteria to make the structures commonly found in mature dental plaque called “corn-cob-configuration”.  When bacteria of the same species stick to each other it’s known as “aggregation”. In this case the bacteria are from different species and it’s known as “CO-aggregation”.


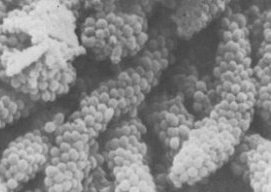
“Corn Cobs” in Dental Plaque 


And finally

You may have guessed by now that I’m a bit skeptical about using the term “fimbriae” to describe the surface structures of these oral streptococci. I prefer to describe them all as fibrils but I’ll probably end up in the minority.  Sooner or later this is all going to be resolved but for the time being it’s probably best to keep the term “fimbriae” reserved for those brittle hair-like, proteinaceous surface projections of Gram-negative rods like Escherichia and Salmonella and call everything else “fibrils”.

Just remember pili are fimbriae and fibrils are different and you won’t go far wrong.


SUMMARY
1. Fimbriae are appendages which have been seen on the surfaces of a range of Gram-negative rods such as E.coli and various species of Salmonella
2. Fimbriae come in 7 different types (I-VII) distinguished by their length and width
3. Fimbriae are thought to be important in adhesion and have been shown to be pathogenicity factors in pathogenic strains of E.coli.
4. Type VII fimbriae allow DNA transfer between mating strains of certain species such as E.coli
5. Fibrils are found on streptococci
6. Fibrils are different from fimbriae, they are thinner and appear to be more flexible
7. Some fibrils have been shown to function in adhesion e.g. in corn-cob-formations found in dental plaque


http://www.ncl.ac.uk/dental/oralbiol/oralenv/tutorials/fimbriae.htm