Lab 10 – Physiology of the Circulatory System


Lab 10   Physiology of the Circulatory System


Introduction: The human circulatory system is a collection of structures thorough which oxygen and nutrient rich blood flows to all tissues of the body for metabolism and growth, and to remove metabolic wastes. The blood is pumped to these tissues by the heart through a circuit composed of arteries, arterioles, capillaries, venules, and veins. Oxygenated blood is pumped to the tissues from the left side of the heart, whereas deoxygenated blood is pumped to the lungs from the right side of the heart. This circuit where gas exchange takes place within the alveoli of the lung is very important and is known as the pulmonary circuit. When the body is exercised changes can take place in the circulatory system that allow more blood to pass to actively respiring muscle cells and less to nonmuscular tissue. Increased heart rate, arterial pressure, body temperature, and breathing rate also occur during exercise.

Arterial blood pressure is directly dependant on the amount of blood pumped by the heart per minute and the resistance to blood flow through the arterioles. This is an important measurable aspect of the circulatory system and it is measured using a sphygmomanometer. This device has an inflatable cuff that connects to a hand pump and a pressure gauge, graduated in millimeters of mercury, by rubber tubing. The cuff is wrapped around the upper arm and inflated, the person taking the pressure then listens for two sounds and observes the gauge to determine what the blood pressure is. The systolic number is determined by the first noise heard as the cuff is deflated, and the diastolic number is determined by the last distinct noise heard.

Hypothesis: From this experiment it is expected that a subject’s heart rate and blood pressure will change during rest and exercise based on how physically fit they are. If the subject is in good shape the heart rate will not increase significantly and the blood pressure will increase. The opposite is true of someone in poor shape.

Materials: The materials used in this experiment include a blood pressure kit, alcohol swabs, a stopwatch, two depression slides, a cotton ball, four rubber bands, a pipet, a petri dish, a Daphnia culture, a stereomicroscope, and some ice.

Methods:

A. Measuring Blood Pressure: To measure blood pressure, one member of the lab group sat down in a chair, rolled up his sleeve, and then the sphygmomanometer cuff was placed around his upper left arm at heart level. The cuff was then pumped to 200mm Hg, which is safely higher than the blood pressure of the subject. The stethoscope was then placed in the well of the subject’s elbow, where the brachial artery is located, and pressure was slowly released as the taker listened for a pulse. The pressure on the gauge was noted when first sound of Korotkoff was heard, which is the pressure that blood is first able to pass through the artery during systole, representing systolic pressure. The sounds of Korotkoff are heard between the systolic and diastolic blood pressures. The diastolic pressure is the reading of the gauge at the time the sounds of Korotkoff can no longer be heard. The subject’s blood pressure was taken two more times and an average was calculated and recorded in Table 1.


Average Blood Pressure


Systolic Pressure


Diastolic Pressure

Age in Years Men Women Men Women
10 103 103 69 70
11 104 104 70 71
12 106 106 71 72
13 108 108 72 73
14 110 110 73 74
15 112 112 75 76
16 118 116 73 72
17 121 116 74 72
18 120 116 74 72
19 122 115 75 71
20-24 123 116 76 72
25-29 125 117 78 74
30-34 126 120 79 75
35-39 127 124 80 78
40-44 129 127 81 80
45-49 130 131 82 82
50-54 135 137 83 84
55-59 138 139 84 84
60-64 142 144 85 85
65-69 143 154 83 85
70-74 145 159 82 85


B. Physical Fitness Test: The first numbers recorded from this section of the experiment were those of standing vs. resting blood pressure. To do this a member of the lab group had to lie down on a table for five minutes. After five minutes the subject’s blood pressure was taken while he was still lying down and the numbers were recorded in Table 2. The subject remained lying down for another two minutes, stood up, and their blood pressure was taken again. The standing systolic pressure was subtracted from the resting systolic pressure and recorded in Table 2. A chart was used to determine the number of points received by the subject and recorded in Table 3.

The next part of this section is where the subject’s standing heart rate was determined. Taken by the subject was the radial artery pulse by counting the number of beats for 30 seconds. That number was multiplied by 2 to obtain the number of beats per minute. That number was recorded in Table 3. Another chart was used to determine the amount of points the subject received for this section and that number was also recorded in Table 3.

Next the resting heart rate was determined by having the subject lie down on a table for five minutes. After five minutes the subject’s pulse was taken and recorded in Table 3. Once again a chart was used to determine the number of points the subject received for this section of the experiment and the number was recorded in Table 3.

Next the Baroreceptor reflex test was given to the subject. The subject had to lie down for five minutes, stand up quickly, and record the pulse. From this number the resting heart rate was subtracted and recorded in Table 3. A chart was then used to determine the number of points the subject received for this section and recorded in Table 3.

The endurance test was the last leg of this section of the experiment. To do this the subject stepped up with one foot onto an 18 inch high surface and then brought up the other foot onto the surface. This was continued for 15 seconds, and then his pulse was taken at several intervals. First the pulse was taken right after the exercise for 15 seconds and multiplied by four. This was repeated one more time after that as well. Then the pulse was taken every 30 seconds for 120 seconds after that. The data was recorded in Table 4. The amount of time it took for the subject’s heart rate to return to normal was figured and a chart was used to award points. These heart rates were then compared to the standing heart rate. Next, the standing heart rate was subtracted from the rate taken right after exercise, and yet another chart was used to award points.


C. Investigating Heart Rate in Daphnia: Two depression slides were obtained and a small piece of cotton was placed in the center of one of the slides. Several Daphnia were placed on the slide with a pipet and the other slide was placed on top of this slide and wrapped together with a rubber band on each end. A petri dish was filled with room-temperature water, 1cm deep and the slides were placed into it. The heart of the largest Daphnia was then located under the stereomicroscope and the number of beats in 15 seconds was determined, multiplied by four, and the results placed in Table 5. Into the dish was then added ice water and the same Daphnia’s heart rate was determined and recorded in Table 5. Gradually warm water was added and the heart rate was taken at five minute intervals until the normal heart rate is noted. These results were put in Table 5.

Results:

Table 1


Blood Pressure Systolic Diastolic
Trial 1 115 72
Trial 2 115 70
Trial 3 115 74
Average 115 72


Table 2

Standing vs. Resting Blood Pressure


Position Systolic Diastolic
Lying Down 5 min. 110 72
Lying to Standing 120 72
Change 10 0


Table 3

Fitness Points


Activity Result Fitness Points
Change in Blood Pressure 10 3
Standing Pulse Rate 78 3
Resting Pulse Rate 64 3
Baroreceptor Reflex 76 3
Heart Rate Recovery After Exercise 28 4
Heart Rate Increase After Exercise 18 2
Total Points – 18


Table 4

Heart Rate After Exercise


Interval No. of Beats Heart Rate
0 to 15 sec. 24 X4= 96
16 to 30 sec. 19 X4= 76
31 to 60 sec. 35 X2= 70
61 to 90 sec. 35 X2= 70
91 to 120 sec. 35 X2= 70


Total Score Cardiovascular Fitness
17 to 18 Excellent
14 to 16 Good
8 to 13 Fair
7 or less Poor


Questions:

1. What changes occur in the circulatory system when a person stands up from a prone position? How do these changes affect the heart rate and blood pressure of the individual?


The circulatory system is not working very hard when a person is at rest so when that person stands up suddenly the blood pressure and heart rate of that person increase.


2. How does the circulatory system, and the heart in particular, of a conditioned athlete differ from that of a person in poor shape?


The heart of a conditioned athlete is stronger because it has been worked harder pumping more blood when that person exercises. The heart of a person in poor shape has not been worked as hard.


3. Why is high blood pressure dangerous? What health problems does it lead to?


High blood pressure is dangerous because the heart has to work to hard to push the blood through the various veins and arteries and a heart attack can occur.


4. What sort of behaviors encourage high blood pressure? Why?


Eating fatty foods and not exercising cause high blood pressure because the heart is not working hard to pump the blood, which makes it weak.


Table 5


Temperature (C) Heartbeats per Minute
Room Temperature 200
0 to 5 84
10 160
15 152
20 204
25 200
30 212
35 216


Change in Metabolic Rate


Temperature Range Rate of the reaction (change in heart rate)
0-10 Q10 =1.9
10-20 Q10 =1.275
20-30 Q10 =1.04


Questions:

1. Why does the rate of activity of ectothermic organisms increase with a rise in the temperature of its environment? How is this different from an endothermic organism?


Ectothermic organisms’ body heat is determined by the environment, so their metabolic rates also change with this. Endotherms have a constant body temperature and do not change their metabolic rate strictly based on environmental conditions.


2. If this experiment were performed on a human subject, what results would you expect? Explain.


A human’s heart would also be affected by the temperature changes, but not to the extent that the Daphnia heart did.

Error Analysis: The only possible source of error in this lab would have been the slight misreading of the gauge on the sphygmomanometer.

Conclusions: Cardiovascular fitness is very important to living a healthy life. If one doesn’t exercise and eat healthy foods they run a risk of being in poor shape and having a heart attack or other serious things. Heart rate and blood pressure readings can give a person a good idea about how healthy they are or how healthy they need to be. Blood pressure is so important to a person’s health it is checked at every visit to the doctor or hospital.
 

BACK

Lab 11a Behavior Ap


Lab 11   Animal Behavior

Introduction:


Ethology is the study of animal behavior. An animal’s behavior is its response to sensory input. There are three types of behaviors: orientation, agonistic, and mating.

Orientation behaviors take the animal to its most favorable environment. Taxis is when an animal moves toward or away from a stimulus. Taxis is often characterized by light, heat, moisture, sound, or chemicals. Kinesis is another type of movement that involves orientation. Kinesis is a movement that is random and doesn’t involve a stimulus. So an animal would respond to light by moving everywhere in random directions.

Agonistic behavior is when animals respond to each other in aggressive or submissive movements. Like the hair on dogs backs when they get ready to fight. Another excellent example is the Betta fish, which is sometimes studied in labs.

Mating behaviors are activities that involve finding, courting, and mating with a member of the same species. An example would be a peacock fluffing up its feathers to attract females.


Hypothesis:


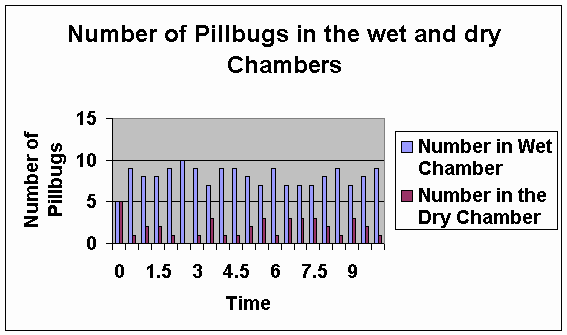
Pill bugs will prefer the wet side to the dry side of the petri dishes because they are used to living in dark moist conditions, such as under rocks or in rotting trees.


Materials:


Materials used in this experiment involved: a double petri dish combination, 10 pillbugs, bedding material, scissors, pencils, 2 pieces of filter paper, a piece of black construction paper, and a watch.


Methods:

Place 10 pillbugs in the petri dishes along with a little bedding material in each container. Observe them for about 10 minutes noting any observations that are characteristic to the bugs. Once that is done, take a piece of filter paper and soak it in water, then put the wet piece in the bottom of one of the containers. Put the other dry paper in the bottom of the other container. Put 5 pillbugs on each side and count how many bugs there are on each side every 30 seconds for 10 minutes.

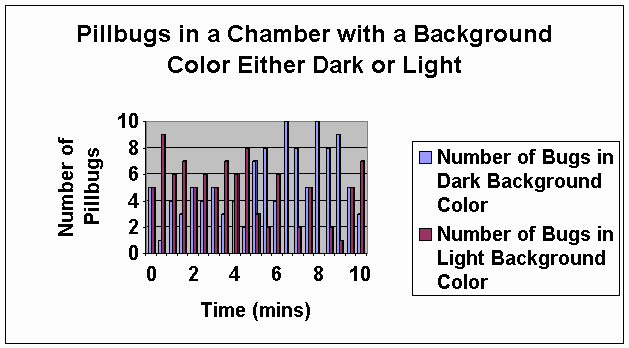
Our designed experiment involved the same methods except substituting filter paper with a piece of black construction paper. Cut out the circular paper from a sheet of black paper and put it in one of the containers along with some bedding material. Place 5 pillbugs on each side and count how many there are on each side every 30 seconds for 10 minutes.


Results:

Table 11.1


Time (mins)


Number in wet Chamber


Number in dry Chamber

0 5 5
.5 9 1
1.0 8 2
1.5 8 2
2.0 9 1
2.5 10 0
3.0 9 1
3.5 7 3
4.0 9 1
4.5 9 1
5.0 8 2
5.5 7 3
6.0 9 1
6.5 7 3
7.0 7 3
7.5 7 3
8.0 8 2
8.5 9 1
9.0 7 3
9.5 8 2
10.0 9 1


Table 11.2


Time (Mins) Number in wet Chamber Number in dry Chamber
0 5 5
.5 9 1
1.0 6 4
1.5 7 3
2.0 5 5
2.5 6 4
3.0 5 5
3.5 7 3
4.0 6 4
4.5 8 2
5.0 3 7
5.5 2 8
6.0 6 4
6.5 0 10
7.0 2 8
7.5 5 5
8.0 0 10
8.5 2 8
9.0 1 9
9.5 5 5
10.0 7 3


1. What conclusion do you draw from your data? Explain physiological reasons for the behavior observed in this activity.

– The bugs preferred it in the wet conditions. They probably like it there because they live in place like that, under rocks or in trees or just in the soil. That is probably the only way they can keep cool and obtain moisture.


2. Obtain results from all lab groups in your class. With respect to humidity, light temperature, and other environmental conditions, which types of environment do isopods prefer? How do the data support these conclusions? Give specific examples.

– Our class didn’t exchange data with each other.


3. How do isopods locate appropriate environments?

– They use their antennae for a lot of their locating. One thing that I observed was they did use their antennae when they were walking around. They probably don’t have very good eyesight.


4. If you suddenly turned a rock over and found isopods under it, what would you expect them to be doing? If you watched the isopods for a few minutes, how would you expect to see their behavior change?

– I would expect them to scurry around, probably find and tunnel and go down it to keep out of the sunlight. If you found one that wasn’t already underground, I would probably see it walking out in the grass, looking for another object to go under.


5. Is the isopod’s response to moisture best classified as kinesis, or taxis? Explain your response.

– I think it’s best classified as kinesis because they moved around in random directions. Some of them just sat there while the others were moving around.


1. Select one of the variable factors above, and develop a hypothesis concerning the pillbug’s response to the factor.

– Background Color- I hypothesize that the pillbugs will prefer the dark background color over the light background color because they are used to living in dark places for most of their lives.


2. Use the material available in your classroom to design an experiment. Remember that heat is generated by lamps.

A) State the objective of your experiment.

– To see if background color has anything to do with behavioral responses in pillbugs to their environment.


B) List the materials you will use.

– Scissors, black construction paper, pillbugs, petri dish containers, and bedding material, as well as a watch.


C) Outline your procedure in detail.

– Our designed experiment involved the same methods as the real experiment except substituting filter paper with a piece of black construction paper. Cut out the circular paper from a sheet of black paper and put it in one of the containers along with some bedding material. Place 5 pillbugs on each side and count how many there are on each side every 30 seconds for 10 minutes.


Error Analysis:


Not many things could have drastically changed our results. All we had to do was to watch them and watch the time. If the bugs were forced into one of the chambers then that could have changed our results. Also if we hadn’t had kept a good time method then we could have been lost.


Conclusions:


The bugs like it in the wet environment because that is what it’s used to. It’s an easy way to get water and stay cool in their environment. They also liked the dark background because, again, that is what they are used to in their environment, under rocks or other things.


Lab 3 Sample Ap Mitosis & Meiosis


Mitosis and Meiosis


Introduction
There are two types of nuclear division, mitosis and meiosis. Mitosis is usually used for the growth and replacement of somatic cells, while meiosis produces the gametes or spores used in an organism’s reproduction.

Mitosis is the first of these studied in this lab. It is easily observed in cells that are growing at a rapid pace such as whitefish blastula or onion root tips, which are used in this lab. The root tips contain an area called the apical meristem that has the highest percentage of cells undergoing mitosis. The whitefish blastula is formed directly after the egg is fertilized. This is a period of rapid growth and numerous cellular divisions where mitosis can be observed.

Just before mitosis the cell is in interphase. In this part of the cell cycle the cell will have a distinct nucleus and nucleoli where the thin threads of chromatin are duplicated. After duplication the cell is ready to begin mitosis and its starts with a step called prophase. In prophase, the chromatin thicken into distinct chromosomes and the nuclear envelope breaks open releasing them into the cytoplasm. The first signs of the spindle begin to appear. Next the cell begins metaphase, where the spindle attaches to the centromere of each chromosome and moves them to the same level in the middle of the cell. This level position is called the metaphase plate. Anaphase begins when the chromatids are separated and pulled to opposite poles. Then, the final stage is telophase. The nuclear envelope is reformed and the chromosomes gradually uncoil. Cytokinesis may occur, in which case, a cleavage furrow will form and the two daughter cells will separate.

Meiosis is more complex and involves two nuclear divisions. The two divisions are called Meiosis I and Meiosis II and they result in the production of four haploid gametes. This process allows increased genetic variation due to crossing over where genes can be exchanged. The process, like mitosis, depends on interphase to replicate the DNA. Meiosis begins with Prophase I. In this stage, homologous chromosomes move together to form a tetrad and synapsis begins. This is where crossing over occurs resulting in the recombination of genes. Metaphase I moves the tetrads to the metaphase plate in the middle of the cell, and Anaphase I reduces the tetrads to their original two stranded form and moves them to opposite poles. Telophase I then prepares the cell for its second division. Meiosis II generally resembles mitosis except that the daughter cells are haploid instead of diploid. DNA replication does not occur in Interphase II, and prophase, metaphase, anaphase, and telophase occur as usual. The only change is the number of chromosomes.

The process of crossing over can be easily studied in Sordaria fimicola, an ascomycete fungus. Sordaria form a set of eight ascospores called an ascus. They are contained in a perithecium until they are mature and ready for release. Crossing over can be observed in the arrangement and color of these asci. If an ascus has four tan ascospores in a row and four black ascospores in a row (4:4 arrangement), then no crossing over had taken place. However, if the asci has black and tan ascospores in sets of two (2:2:2:2 arrangement) or two pairs of black ascospores and four tan ascospores in the middle (2:4:2 arrangement), then crossing over had taken place.


Hypothesis
Mitosis occurs in whitefish blastula and onion root tip, and it is easily observable. Meiosis and crossing over occurs in the production of gametes and spores.

Materials
This lab requires prepared slides of whitefish blastula, onion root tips, and Sordaria, pencil, paper, a light microscope, and a chromosome simulation kit.


Methods
Exercise 3A.1: Observing Mitosis

Prepared slides of whitefish blastula and onion root tips were observed under the 10X and 40X objectives. A cell in each stage of mitosis were identified, and then sketched.

Exercise 3A.2: Time for Cell Replication

Using a high power objective, every cell in a field of view was observed. Each cell was counted as being in one of the stages of mitosis and recorded. At least 200 cells and 3 fields of vision were counted and recorded. Next, the percentage of cells in each stage was recorded and the amount of time spent in each phase was calculated.

Exercise 3B.1: Simulation of Meiosis

In this part of the lab, a chromosome simulation kit was used to demonstrate meiosis. Two strands of the same color were connected to simulate DNA replication in both of the homologous pairs. Next, the chromosomes were entwined to represent synapsis. Sections of beads were switched between the pairs as in crossing over and were aligned at the equator. Next, anaphase was simulated as the homologous pairs were separated and then telophase was simulated by pushing the chromosomes into two separate cells (circles).

Meiosis II was simulated as well. The DNA is not replicated in Interphase II. The chromosomes again move to the equator and in Anaphase II the two chromatids were separated and moved to opposite poles. Telophase II separates them into four different cells.

Exercise 3B.2: Crossing Over during Meiosis in Sordaria

Prepared slides of Sordaria fimicola were observed under a light microscope. Over 100 asci were identified as either 4:4 or asci showing crossover and recorded. The percentage of each and the map units were calculated.

Results

Whitefish Blastula

Onion Root Tip

Table 3.1: Time for Cell Replication


Number of Cells

Field 1 Field 2 Field 3 Total
 

Interphase

42 36 47 125 61.27% 14 hours 42 minutes
 

Prophase

10 13 18 41 20.10% 4 hours 49 minutes
 

Metaphase

6 5 4 15 7.35% 1 hour 46 minutes
 

Anaphase

2 3 2 7 3.43% 49 minutes
 

Telophase

7 5 4 16 7.84% 1 hour 59 minutes

204


Table 3.2: Compare Mitosis and Meiosis


Mitosis


Meiosis


Chromosome number of parent cells

Diploid (2n) Diploid (2n)
 

Number of DNA replications

Once Once
 

Number of divisions

One Two
 

Number of daughter cells produced

Two Four
 

Chromosome number of daughter cells

Diploid (2n) Haploid (n)
 

Purpose

Growth and repair Production of gametes or spores


Simulation of the Meiosis I

Table 3.3: Sordaria


Number of 4:4


Number of Asci Showing Crossover


Total Asci


% Asci Showing Crossover Divided by 2


Gene to Centromere Distance (Map Units)

53 64 117 27.35% 27.35


Meiosis with Crossing Over – 2:4:2 Arrangement

Questions:

Why is it more accurate to call mitosis “nuclear replication” rather than “cellular division”?

It is more accurate to say “nuclear replication” to describe mitosis because the actual cell splitting occurs in cytokinesis. The whole process of mitosis is a series of steps that split the nucleus into two separate nuclei at opposite poles.

Explain why the whitefish blastula and onion root tips are selected for a study of mitosis.

The blastula is a hollow ball of cells that forms from the fertilization of an egg. Rapid growth occurs and numerous cellular divisions making mitosis in various stages easy to observe. Onion root tips are also a region of high percentage of cells going through mitosis because this is where most of the root growth takes place.

If your observations had not been restricted to the area of the root tip that is actively dividing, how would your results differ?

There would be virtually no cells undergoing division, so many more of the cells observed would have been in interphase where they elongate an differentiate.

Based on the data in Table 3.1, what can you infer about the relative length of time an onion root-tip cell spends in each stage of cell division?

Prophase is the longest stage of mitosis and then going in sequential order each decreases in the length of time it takes to complete.

List three major differences between the events of mitosis and meiosis.

In mitosis, the nucleus is only divided once, while in meiosis the nucleus is divided twice. Another difference is that mitosis produces two identical daughter cells, but meiosis produces up to four different daughter cells. Also, synapsis and crossing over do not take place in mitosis, but do take place in meiosis.

How are Meiosis I and Meiosis II different?

Meiosis I begins with a tetrad and separates the homologous pairs. Meiosis II separates the two sister chromatids.

How do oogenesis and spermatogenesis differ?

Oogenesis produces an egg cell, while spermatogenesis produces sperm cells.

Why is meiosis important for sexual reproduction?

In meiosis the chromosome number is reduced to n so that it can be fertilized. Also, meiosis allows for crossing over, which results in variations in organisms.

Error Analysis
There was little chance for error in this lab. It was mostly observation and sketching. However in Exercise 3A.2, the numbers for telophase were off. The calculations obtained for its time were too high; it should have been the shortest stage of meiosis. This may be caused by misidentifying the stages or counting the daughter cells as two different cells. Misidentification could have caused errors in the other parts of this lab as well.


Discussion and Conclusion
Mitosis was observed and timed in Lab 3A. The stages of mitosis are prophase, metaphase, anaphase, and telophase, prophase being the longest and telophase the shortest. Meiosis was simulated in Lab 3B and then crossing over was observed in Sordaria and the map units were determined. The gene to centromere distance in the Sordaria was 27.35 map units.

BACK


Introduction Worksheet BI

Introduction to Biology Review

1. All living things are called _______________________.

2. The approximately 40 million types of living things on Earth are known as ______________________.  How many have been identified? __________________.

3. The land, water, and air on Earth that sustains life is known as the ___________________________.

4. A species is a group of organisms so similar to one another that they can _______________________ or _____________________________.

5. Evolution simply means ______________________________________.

6. When hereditary information from two parts of a single organism or from two organisms of the same species is combined it is called  _______________________.

7. An organism that must take in food is a(n) _________________________.

8. The encoded, genetic instructions for making many other molecules necessary for life is called  __________________. 

9.  Produces greatly magnified images of surface details ________________  _____________  __________________  or ______________.

10. Increase of an object’s apparent size is ________________________________.

11. The production of offspring is called __________________________________.

12. The formation of two cells from an existing cell is called ______________   _____________________________.

13. Produces a greatly magnified image of internal details ___________________  _______________   ______________ or _____________.

14. Ultimately, almost all living organisms get their energy from the _______________.

15. ______________________  reproduction involves no recombination of genetic material, or exact duplication of the parent.

16. ________________________ reproduction involves combining hereditary information from two  different species or from two organisms of the same species.

17. A short segment of DNA that contains instructions for a single trait is called a(n) __________________________.

18. What is the smallest unit of life capable of carrying out all life functions?

19. Sum of all chemical processes of an organism _______________________________.

20. Through the process of ____________________________________ plants capture the energy from the sun and change it into a form of energy that can be used by living things.

21. Capability of showing clear details refers to ________________________________.

22. The study of how organisms interact with each other and their environment is called ___________________________.

23. The process by which an adult organism arises is called _______________________.

24. When hereditary information from different organisms is not combined it is called __________________________ reproduction.

25. An organism that makes its own food is called a(n) __________________. Give an example.

26. To maintain their internal organization, all living things must have a constant supply of _____________________.

27. Reproduction involves the transfer of genetic information from _____________________  to ____________________.

28. The stable internal environment maintain by living things is called ________________.

29. The most important driving force in evolution is ____________________.

30. The scientific process that involves using the five senses is _______________________.

31. Data that are quantitative are always represented by __________________________.

32. A hypothesis is a statement that can be _______________________________.

33. A broad and comprehensive statement of what is believed to be true is a(n) ______________________________.

34. A small part used to represent an entire population is called a(n) __________________________________.

35. Organisms that are composed of only one cell are called _________________.

36. Organisms composed of more than one cell, such as a plant, are called ______________________.

37. What type of microscope has the greatest magnification?

38.  Cell division and cell enlargement together results in ____________________.

39. Cell division and cell differentiation results in ________________________.

40. How does a theory differ from a hypothesis?

41. List the six major characteristics of living things.


42.  Compare cell division in unicellular & multicellular organisms.


43. Why is it important for scientist to communicate about their work?


44. Why do scientists use SI rather than the system of measurement adopted for use in their own country?

45. How do autotrophs differ from heterotrophs in obtaining energy?

46.  Would a field biologist who studies the ecology of a bird species necessarily use the same scientific methods as a laboratory biologist who studies how a virus infects cells?  Why or Why Not?

47.  How does the growth of a nonliving thing differ from growth of a living thing?

48. Why are so many organisms yet to be discovered, identified, and described?


49. List the six major themes of biology.

BACK


Insect Web Page


Insects on the Web

Task:

Your Team is responsible for comparing 5 insect species within an order of insects. You will present your findings on a web page that other students will view. There are hundreds of sites on the web that will help you in your quest. Try to be creative and engaging as you plan your presentation. Pictures and color are good! Imagine that your classmates will be reading and judging these pages.

Process:

  1. First, your Team must choose what order of insects will be studied. You may choose from the following groups. Each order may have hundreds or even thousands of individual species. Your final project should showcase 5 of these species.
Insect Orders
Coleoptera

Lepidoptera (only moths)

Hymenoptera (ants only)

Lepidoptera (only butterflies)

Hemiptera

Odonata (dragonflies only)

Odonata (damselflies only)

Homoptera

Isoptera

Hymenoptera (wasps only)

Hymenoptera (bees only)

Diptera (mosquitoes only)

Diptera (flies only)

Orthoptera (grasshoppers only) 


  1. Collect resources and information about your insect. You may want to divide responsibilities among the group members.

Questions to consider as you investigate.

  • How are these insects alike?
  • How are these insects different?
  • Where does the insect live?
  • What does it eat?
  • Is it a pest insect or is it an insect that is good for the environment?
  • How does the insect reproduce?
  • What does it look like? (snag pictures for use on your presentation-left click mouse and choose “save image”)
  1.  Compile the data to make a website. Your website should include:
  • A Title
  • At least one picture of each species
  • Include the common and scientific name of each species
  • Descriptions of each insect that answer your investigation questions
  • An explanation of why the five insects are grouped together (related)
  • Economic effect of these species (good &/or bad)
  • A list of web sites (links) where the reader can find more information about your insects
  • Credits: list of your team members and the areas they were responsible for.
  • Five questions that can be answered with the information found on your page. These questions will be answered by your classmates when they look at your page.
  1. Construct the website. Your website can be made using Project Poster at http://poster.hprtec.org/. Here you can place your pictures and information for others to view it. Your teacher will give you more information on how to name your account and use Project Poster.

Daily Goals – use as a guideline to stay on track in your project

Day One
Day Two
Day 3
Day 4
Team assigned, they should get together and discuss which insect grouping they want to study. Each should go to the computers and find resources on that insect. Jot down notes about the groupings, and list species. This information can be used for the Overview section of the project.


Group discusses their findings from Day 1, responsibilities are assigned. Determine who will study which species. Use computers to study your species, gather data and collect images. Team reforms to share data and begin designing the layout of the page. Determine what information should be included, and how the pictures should be arranged. Begin creating web page Finish web page creation, tie up any loose ends and consult the evaluation rubric to make sure you’ve included all the information you need to get an A.

Resources

Search engines

www.yahoo.com
www.lycos.com
www.google.com
www.dogpile.com


Useful Sites

Entomology for Beginners
City Bugs
Antboy’s BugWorld
Insect Science Education Outreach
Bugbios

Evaluation Rubric

Needs work (1 pt)
Satisfactory (2 pts)
Excellent
(3 pts)
Total Possible
Page Layout Either title or team names missing, responsibilities not present Title and team names included but are not obvious, responsibilities vague Title and Team names included, and easy to find, team responsibilities listed 3
Images Some insect images present Most insect images are present All insect images are present 3
Creativity Page is hard to read and disorganized Page has some organization and can be followed Page organized and easy to follow 3
Content
Insect descriptions Insects are not well described, investigation lacking and most of the insects are not identified correctly Insects are described, only a few of the investigation questions are answered. Some names included Each insect has a thorough description, answers most of the investigation questions. Species name included 3
Questions for Content Less than 5 questions included, but are not related to the site and cannot be easily answered. 5 questions are included, some cannot be easily answered from the page content 5 related questions are included and can be answered from your page 3
References Less than 3 links present, sources unreliable Less than 3 links present, but sources are reliable 3 links present to other reliable sources 3
Overview Some relationships between the insects are given, unclear or not obvious Project describes how the insects are related and how they different, slightly unclear Project shows a good introduction that describes the group of insects and how they are related 3
Total Possible for Project
24 pts