| pH and Living Systems |  |
Introduction:
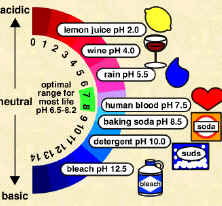
Scientists use something called the pH scale to measure how acidic or basic a liquid is. The scale goes from 0 to 14. Distilled water is neutral and has a pH of 7. Acids are found between 0 and 7. Bases are from 7 to 14. Most of the liquids you find every day have a pH near 7. They are either a little below or a little above that mark. When you start looking at the pH of chemicals, the numbers go to the extremes. Substances with the highest pH (strong bases) and the lowest pH (strong acids) are very dangerous chemicals. Molecules that make up or are produced by living organisms usually only function within a narrow pH range (near neutral) and a narrow temperature range (body temperature). Many biological solutions, such as blood, have a pH near neutral.
The biological molecule used in this lab is a protein found in milk. Proteins are used to build cells and do most of the cell’s work. They also act as enzymes. For proteins to work, they must maintain their globular shape. Changing the shape of a protein denatures and the protein will no longer work.
Materials:
Small squares of wide-range pH paper, pH color chart, paper towels, 4 dropper bottles, ammonia, lemon juice, skim milk, distilled water, forceps, 50 ml beakers, small squares of narrow-range pH paper, 2 stirring rods
Procedure (part A): Testing the pH of Substances
- Line up 4 squares of wide-range pH paper about 1 cm apart on a paper towel.
- Put one drop of distilled water on the pH square.
- Compare the color of the pH paper to the color chart and record the pH in data table 1.
- Repeat this procedure for the ammonia, lemon juice, and skim milk.
Questions (Part A): Determining the pH of Solutions
- Which substance was the most acidic?
- Which substance was the most basic?
- Did any of the substances have a pH close to neutral? Name them.
Procedure (part B): Showing the Effect of pH on a Biological Molecule (Milk Proteins)
- Place 100 drops of skim milk in a 50 ml beaker.
- Pick up a piece of narrow-range pH paper with forceps.
- Touch the pH paper to the milk and remove it.
- Compare the color of the pH paper to the pH color chart.
- Record the initial pH in data table 2.
- Add a drop of lemon juice to the milk in the cup & stir with a stirring rod. Keep track of how many drops you add to the milk!
- Measure and record the pH of the solution with the narrow-range pH paper.
- Repeat step 7 until you notice an obvious change in the appearance of the milk. record this final pH and appearance of the milk in your data table.
- Repeat steps 1-8 using a clean 50 ml beaker and fresh milk, and substitute ammonia for the lemon juice.
- Add drops of ammonia to the milk until the change in pH of the milk is equal to the change in pH you measured in step 8. Be sure to keep track of the number of drops added. HINT: If the pH changed by 2 units with the lemon juice, then add ammonia until you also get 2 pH units of change!
Data:
Table 1
| Substance Tested | pH | Acid | Base | Neutral |
Table 2
| Substance Tested | Substance used to Produce Change | Starting pH of Milk | Final pH of Milk | Original Appearance of Milk | Final Appearance of Milk | Total Number of drops added to Produce the change |
| 100 drops Skim Milk | Lemon Juice | |||||
| 100 drops Skim Milk | Ammonia |
Questions:
1. Which substance tested from table 1 was the most acidic?
2. Which substance was most basic?
3. Did any substance from table 1 have a neutral, or near neutral pH? If so, which substance was neutral?
4. Why did you use narrow-range pH paper to measure the milk’s change in pH?
5. Describe the change in appearance of the milk as more lemon juice was added. Explain why this change occurred.
6. How much did the pH of milk change when lemon juice was added?
7. Why do you think lemon juice “curdled” (precipitated out the proteins) from the milk?
8. Did you get the same change when ammonia was used? Why or why not?
