Random Sampling
Introduction
Scientists cannot possibly count every organism in a population. One way to estimate the size of a population is to collect data by taking random samples. If you survey every person or a whole set of units in a population you are taking a census. However, this method is often impracticable; as it’s often very costly in terms of time and money. For example, a survey that asks complicated questions may need to use trained interviewers to ensure questions are understood. This may be too expensive if every person in the population is to be included.
Sometimes taking a census can be impossible. For example, a car manufacturer might want to test the strength of cars being produced. Obviously, each car could not be crash tested to determine its strength!
To overcome these problems, samples are taken from populations, and estimates made about the total population based on information derived from the sample. A sample must be large enough to give a good representation of the population, but small enough to be manageable. Data obtained by random sampling can be compared to data obtained by actual counts. By comparing data from random sampling to the actual count, you can compute the percentage error to determine the accuracy of the random sampling.
Objective
The size of a population can be determined using the random sampling method.
Materials
Pencil
Scissors
Sheet of paper
2 envelopes
Procedure
- Tear a sheet of paper into 20 slips, each approximately 4cm x 4 cm.
- Number 10 of the slips from 1 to 10 and put them in an envelope.
- Label the remaining 10 slips from A through J and put them in a second envelope.
- Use the grid below for you random and actual counts. The grid represents a meadow measuring 10 meters on each side. Each grid segment is 1m x 1m. Each black circle represents one sunflower plant.
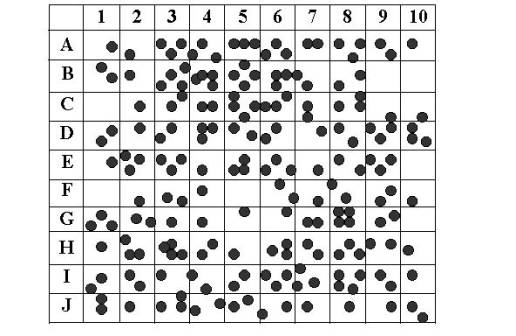
- Randomly remove one slip from each envelope. Write down the number-letter combination and find the grid segment that matches the combination. Count the number of sunflower plants in that grid segment. Record this number on Data table 1. Return each slip to its appropriate envelop.
- Repeat step 5 until you have data for 10 different grid segments (and the table is filled out). These 10 grid segments represent a sample. Gathering data from a randomly selected sample of a larger area is called sampling.
- Find the total number of sunflower plants for the 10 segment sample. This is an estimation based on a formula. Add all the grid segment sunflowers together and divide by ten to get an AVERAGE number of sunflower plants per grid segment. Record this number in the table. Multiple the average number of sunflower plants by 100 (this is the total number of grid segments) to find the total number of plants in the meadow based on your sample. Record this number in Data Table 1.
- Now count all the sunflower plants actually shown in the meadow. Record this number in Data Table 2. Divide this figure by 100 to calculate the average number of sunflower plants per each grid.
Data Table 1
Random Sampling Data |
|
| Grid Segment (number-letter) |
Number of Sunflowers |
| Total Number of Sunflowers |
|
| Average per grid (divide total by 10) |
|
| Total number of plants in meadow (multiply average by 100) |
|
Data Table 2
Actual Data |
|
| Total number of Sunflowers (count by hand) |
|
| Average number of Sunflowers (divide total by 10) Per grid |
|
Questions
1. Compare the total number you got for sunflowers from the SAMPLING to the ACTUAL count. How close are they?
2. Why was the paper-slip method used to select the grid segments?
3. Why do biologists use Sampling? Why can’t they just go into the forest and count all the sunflower plants?
4. Population Sampling is usually more effective when the population has an even dispersion pattern. Clumped dispersion patterns are the least effective. Explain why this would be the case.
5. Describe how you would use Sampling to determine the population of dandelions in your yard.
6. In a forest that measures 5 miles by 5 miles, a sample was taken to count the number of silver maple trees in the forest. The number of trees counted in the grid is shown below. The grids where the survey was taken were chosen randomly. Determine how many silver maple trees are in this forest using the random sampling technique. Show your work!
| 7 | ||||
| 3 | ||||
| 5 | ||||
| 11 | 9 | |||