| Diffusion and Osmosis |
Introduction:
Atoms and molecules are the building blocks of cells. Both have kinetic energy and are constantly in motion. They continually bump into one another and bounce off into new directions. This action results in two important processes, diffusion and osmosis.
Diffusion is the random movement of molecules from an area of higher concentration of those molecules to an area of lower concentration. Cells have selectively permeable membranes that only allow the movement of certain solutes. Diffusion is vital for many of life’s functions in a cell. It allows oxygen and carbon dioxide exchange in the lungs and between the bodies of intracellular fluid and cells. Diffusion also aids in the transport of nutrients and water in the xylem and phloem of plants. In those plants, it permits for the absorption of water into roots. An example of this process is the diffusion of a smell in a room. Eventually dynamic equilibrium will be reached. This means that the concentration of the molecules carrying the smell will be approximately equal through out the surrounding enclosed area and no net movement of the molecules will occur from one area to another.
Osmosis is special kind of diffusion. It is the diffusion or movement of water through semi-permeable membranes from a region of higher water potential (hypotonic solute) to a region of lower water potential (hypertonic solute). Water potential is the measure of free energy of water in a solution. There are three types of solutions. Isotonic solutions have an equal concentration of solute on both sides of the membrane, and dynamic equilibrium has been reached in the solution. Hypertonic solutions have a higher concentration of solute on one side of the membrane than the other. Hypotonic solutions are the opposite of hypertonic solutions. A solute is what is being dissolved by the solvent (water is the most common solvent) in a solution.
Water will always move from an area of higher water potential to an area of lower water potential. An important factor effecting of diffusion and osmosis is water potential. Water potential measures the tendency of water to leave one place in favor of another place. Water potential is affected by two physical factors. One factor is the addition of solute, which lowers the water potential. The other factor is pressure potential. An increase in pressure raised the water potential. The water potential of pure water at atmospheric pressure is defined as being zero. The Greek letter psi is used to represent water potential. The following formula can be used for calculations:
ψ (Water potential) = ψp (Pressure potential) + ψs (Solute potential)
Movement of water into and out of a cell is influenced by the solute potential on one side of the cell membrane relative to the other side. Plasmolysis is a phenomenon in walled plant cells in which the cytoplasm shrivels and the plasma membrane pulls away from the cell wall when the cell loses water to a hypertonic environment. This leads to a loss of turgor pressure (the force directed against a cell wall after the influx of water and the swelling of a walled cell due to osmosis) and eventual death of the plant. If water moves into the cell, the cell may lyse, or burst (in animal cells, plant cells are equipped to handle large intakes of water). Water movement is directly proportional to the pressure on a system. Pressure potential is usually positive in living cells and negative in dead ones.
Diffusion and osmosis are not the only processes responsible for the movement of ions or molecules in an out of cells. Active transport is process that uses energy from ATP to move substances through the cell membrane. Normally, active transport moves a substance against its concentration gradient, that is to say from a region of low concentration to an area of higher concentration.
Hypothesis:
Osmosis and diffusion will continue until dynamic equilibrium is reached and net movement will no longer occur. Diffusion is effected by the solute size and concen-tration gradient across a selectively permeable membrane. Water potential greatly determines the results in sections of the experiment.
Materials:
Exercise 1A
For this exercise, the following materials are required: a 30 cm of 2.5 cm dialysis tubing, 250 ml beaker, distilled water, funnel, 2 dialysis tubing clamps, 15 ml of 15% glucose/1% starch solution, 4 pieces of glucose tape, 4 ml of Lugol’s solution (Iodine Potassium-Iodide or IKI), a timer, paper and pencil.
Exercise 1B
This exercise of the experiment requires six strips of 30 cm dialysis tubing, 250 ml beaker, 12 dialysis tubing clamps, funnel, six cups, distilled water, an electronic balance, timer, paper towels, and about 25 ml of each of these solutions: distilled water, 0.2 M glucose, 0.4 M glucose, 0.6 M glucose, 0.8 M glucose, and 1.0 M glucose. For recording results, paper and pencil are necessary.
Exercise 1C
This part of the experiment requires a large potato, potato corer (about 3 cm long), 250 ml beaker, paper towels, scale, six cups, knife, paper, pencil and about 100 ml of each of these solutions: distilled water, 0.2 M glucose, 0.4 M glucose, 0.6 M glucose, 0.8 glucose, and 1.0 M glucose.
Exercise 1D
This section requires a calculator, paper, pencil, and graphing paper.
Exercise 1E
This section of the experiment requires paper, pencil, paper towels, onionskin, dye, microscope, slide, cover slip, salt water (15%), and tap water.
Methods:
Exercise 1A
First, soak the dialysis tubing in distilled water for 24 hours. Before handling the tubing, wash dirty hands thoroughly to prevent getting oils on the dialysis tubing and changing the results. Remove the tubing and tie off one end using the clamp. To use the clamp, twist the end of the bag several times and then fold it onto itself. Next, open the other end of the tubing by rubbing the end between two fingers. Fill it with the glucose/starch solution using a funnel. Use the glucose tape by dipping it into the solution. Record the color change of the tape and the color of the bag. Tie of the end with the tubing clamp. It is necessary to leave space for expansion but no air. Fill the beaker with distilled water and add the 4-ml of Lugol’s solution. Record the color change. Use glucose tap to test for any glucose in the water. Record these results. Set the dialysis tubing in the beaker and let it sit for about 30 minutes. Remove the bag and record the change in water and bag color. Use the last two pieces of glucose tape to measure the glucose in the water and bag. Record results.
Exercise 1B
First, soak the dialysis tubing for about 24 hours. Again be sure to cleanse hands. Tie off one end of each tube with the clamps. Next, fill each tube with a different solution (distilled water, 0.2 M glucose, 0.4 M glucose, 0.6 M glucose, 0.8 glucose, and 1.0 M glucose) with the funnel and tie off the end again leaving empty space, but no air. Weigh each bag separately on the electronic balance and record the masses. Soak the bags in separate cups filled with distilled water for about 30 minutes. Remove the bags and gently blot dry with paper towel. Reweigh, and record the mass.
Exercise 1C
First, slice the potato into to 3-cm discs. Use the potato corer to core out 24 cores. Weigh 4 cores together and record their mass. Fill each cup with one of the following solutions: distilled water, 0.2 M glucose, 0.4 M glucose, 0.6 M glucose, 0.8 glucose, and 1.0 M glucose. In each cup put 4 potato cores, and allow them to sit over night. Take out the cores and blot them dry. Again weigh them on the electronic scale. Record the change in mass. Calculate the information for the table. Compare the results with another group.
Exercise 1D
First, determine the solute potential of the glucose solution, the pressure potential, and the water potential. Graph the information given about the zucchini cores.
Exercise 1E
Prepare a wet mount slide of dyed onion skin. Observe under a light microscope and sketch how the cells appear. Add a few drops of the salt solution using a paper towel to wick the solution under the slip. Observe how the cells are effected and make another sketch.
Results:
Exercise 1A
Table 1: Change of Color of Dialysis Tubing and Beaker
|
Solution Color |
Presence of Glucose (Glucose Tape) |
||||
|
Initial |
Final |
Initial |
Final |
||
|
Dialysis Bag |
15% Glucose/1% Starch | Milky White | Midnight Blue | Algae Green | Mahogany |
|
Beaker |
Water + IKI | Amber | Rusty Amber | Pear Green | Olive Green |
Initial Glucose Tests Final Glucose Tests
Which substance(s) are entering the bag and which are leaving the bag? What experimental evidence supports your answer? Iodine Potassium Iodide and water enter the bag. This is proven by the color change (starch test) and the increase in the size of the bag. Glucose left the bag and this is proven by a positive test on the surrounding water.
Explain the results you obtained. Include the concentration differences and membrane pore size in your discussion. The results show that the water, glucose, and IKI molecules were small enough to pass through the selectively permeable membrane. The starch didn’t leave the beaker because its molecules were too large to pass through the selectively permeable membrane’s pores.
Quantitative data uses numbers to measure observed changes. How could this experiment be modified so that quantitative data could be collected to show that water diffused into the dialysis bag? The bags could be massed before and following their immersion in the solution. The volume of the solution in the beaker could be found before and after the immersion of the bag by using a graduated cylinder.
Based on your observations, rank the following by relative size, beginning with the smallest: glucose molecules, water, IKI, membrane pores, and starch molecules. The smallest substance was water, then the IKI molecules, glucose, the membrane pores, and the largest substance was the starch molecules.
What results would you expect if the experiment started with a glucose and IKI solution inside the bag and only starch and water outside? Why? Based on the size of the molecules, the glucose and IKI would move out of the bag and the water would go in. The large starch molecules would be left in the beaker.
Exercise 1B
Table 2: Dialysis Tubing Mass Change Results: Individual Data
|
Contents of Dialysis Tubing |
Initial Mass (g) |
Final Mass (g) |
Mass Difference (g) |
Percent Change in Mass |
|
a) Distilled Water |
26.0 | 26.2 | 0.2 | .77% |
|
b) 0.2 M |
27.0 | 27.5 | 0.5 | 1.85% |
|
c) 0.4 M |
25.0 | 25.6 | 0.6 | 2.4% |
|
d) 0.6 M |
27.9 | 31.4 | 3.5 | 12.54% |
|
e) 0.8 M |
28.3 | 32.0 | 3.7 | 13.07% |
|
f) 1.0 M |
28.4 | 34.6 | 4.7 | 16.55% |
Table 3: Dialysis Tubing Mass Change Results: Group Data
|
Solution |
Group 1 |
Group 2 |
Group 3 |
Average |
|
a) Distilled Water |
.77% | 1.53% | .83% | 1.04% |
|
b) 0.2 M |
1.86% | 5.30% | 1.9% | 3.02% |
|
c) 0.4 M |
2.4% | 2.22% | 2.2% | 2.27% |
|
d) 0.6 M |
12.54% | 9.75% | 11.8% | 11.36% |
|
e) 0.8 M |
13.07% | 9.64% | 12.3% | 11.67% |
|
f) 1.0 M |
16.55% | 18.98% | 16.9% | 17.48% |
|
Team Members |
Tripp & Stephanie | Hudgens & Kris | Elizabeth & Julie | NA |

Graph 1: Percent Change in Mass of Dialysis Tubing in Sucrose Solutions of Different Molarities
Explain the relationship between the change in mass and the molarity of sucrose within the dialysis bags. The molarity is directly proportional to the percent change in mass. As the mass percentage increases, so does the molarity.
Predict what would happen to the mass of each bag in this experiment if all the bags were placed in a 0.4-M sucrose solution instead of distilled water. Explain your response. They are inversely proportional because whenever the sucrose molarity inside the bag is more concentrated, it will become more dilute and vice versa. The solutions will reach equilibrium somewhere between the two concentrations.
Why did you calculate the percent change in mass rather than simply using the change in mass? Each group began with different amounts of solution for their initial mass. Therefore, results cannot be based on those numbers. The differences in mass don’t deal with the proportional aspect of the solutions, making the real results less accurate. The percent was calculated to give the exact difference, along with considering the quantities of solution.
A dialysis bag is filled with distilled water and then placed in a sucrose solution. The bag’s initial mass is 20g, and its final mass is 18g. Calculate the percent change of mass, showing your calculations in the space below. 18g (final mass) – 20g (initial mass) / 20g (initial mass) = 2/20g x 100 = 10% change of mass
Exercise 1C
Table 4: Potato Core: Individual Results
|
Contents in Beaker |
Initial Mass (g) |
Final Mass (g) |
% Change in Mass |
| Distilled Water | 1.8 | 2.1 | 16.7% |
| 0.2 M Sucrose | 1.5 | 1.7 | 13.3% |
| 0.4 M Sucrose | 1.5 | 1.8 | 20.0% |
| 0.6 M Sucrose | 1.6 | 1.3 | -18.75% |
| 0.8 M Sucrose | 1.4 | 1.1 | -21.4% |
| 1.0 M Sucrose | 1.6 | 1.3 | -18.75% |
Table 5: Potato Core Results: Class Data
|
Contents |
Group 1 |
Group 2 |
Total |
Class Average |
|
Distilled Water |
16.7% | 28.5% | 45.2% | 22.6% |
|
0.2 M Sucrose |
13.3% | 21.4% | 34.7% | 17.35% |
|
0.4 M Sucrose |
20.0% | 14.28% | 34.28% | 17.14% |
|
0.6 M Sucrose |
-18.75% | -20.0% | -38.75% | -19.38% |
|
0.8 M Sucrose |
-21.4% | -26.66% | -48.06% | -24.03% |
|
1.0 M Sucrose |
-18.75% | -21.42% | -40.17% | -20.09% |
|
Team Members |
Stephanie, Tripp, & Eli | Hudgens
Kris |
NA | NA |

Graph 2: Percent Change in Mass of Potato Cores at Different Molarities of Sucrose
Exercise 1D

Graph 3: Percent Change in Mass of Zucchini Cores at Different Molarities of Sucrose
If a potato is allowed to dehydrate by sitting in the open air, would the water potential of the potato cells decrease or increase? Why? The water potential of the potato would decrease because water moves from a high water potential region to a low potential region, and a dehydrated potato cell is hypertonic in comparison with the environment. The concentration of solute would increase and osmotic potential would decrease.
If a plant cell has a lower water potential than its surrounding environment, and if pressure is equal to zero, is the cell hypertonic or hypotonic to its environment? Will the cell gain water or lose water? Explain your response. If the plant cell has lower water potential, that means the water will come into the cell; the cell is hypertonic to its environment. This cell will gain water because water follows its concentration gradient.
In figure 1.5, the beaker is open to the atmosphere. What is the pressure potential of the system? The pressure potential is zero.
In figure 1.5, where is the greatest water potential? The greatest water potential is within the dialysis bag.
Water will diffuse_________the bag. Why? Water will diffuse out of the bag because the inside of the bag has the highest water potential.
Calculate solute potential of the sucrose solution in which the mass of the zucchini cores does not change. Show work. ψ s = -iCRT ψ s = (-1)(0.36 mole/liter)(0.0831 liter bar/mole K)(300 K) ψ s = -8.975 bars
Calculate the water potential of the solutes within the zucchini cores. Show work. ψ = ψ s+ ψ p ψ =0 + -8,975 , ψ = -8.975 bars
What effect does adding solute have on the solute potential component of that solution? Why? Adding solute to a solution would increase the solute potential and decrease the water potential.
Consider what would happen to a red blood cell placed in distilled water:
a. Which would have the higher concentration of water molecules? The
distilled water would have the higher concentration of water molecules.
Which would have the higher water potential? The distilled water would also have the higher water potential.
What would happen to the red blood cell? Why? The red blood cell would take in a lot of water and might lyse due to pressure inside. This is because animal cells lack tolerance under hypotonic situations.
Exercise 1E
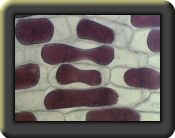
Describe the appearance of the onion cells. The onion cells appear to have great turgor pressure, spread out, thick and bright in the inside. The cell walls were very defined and it was clear where one cell ended and another began.
Describe the appearance of the onion cells after the NaCl was added. The plasma membrane shriveled from the cell wall, or in other words, plasmolysis occurred.
Remove the cover slip and flood the onion with fresh water. Observe and describe what happened. The onion cells were again hypertonic to their environment and were restored to their original state of appearance.
What is plasmolysis? Plasmolysis is the separation of the plasma membrane from the cell wall in a plant cell.
Why did the onion cell plasmolyze? The environment around the cell was hypertonic to the cell so water left the cell to reach dynamic equilibrium with the NaCl solution. With all the water leaving the cell, the cell membrane separated from its cell wall.
In the winter, grass often dies near roads that have been salted to remove ice. What causes this to happen? The salt causes the grass’s environment to become hypertonic, and the water leaves the plant cells, causes withering and eventually death of the plant. The high concentration of salt in the soil also speeds the death of the plant.
Sketch of Onion Cells Onion Cells + NaCl
Error Analysis:
Several could have possibly been made throughout the lab.
Exercise 1A
The data collected in this lab experiment did not appear to contain any errors, however, an error in the results may have unknowingly occurred. If there was a leak where the tubing was twisted shut or a tear in the dialysis tubing, all of the data would be inaccurate.
Exercise 1B
This section of the lab had to be repeated because of incorrect data (that is to say it did not “harmonize” with the other groups’ data). If the person handling the dialysis tubing did not wash their hands thoroughly and accidentally touched the portion of the tubing to serve as the permeable membrane, the oils from their hands could have blocked pores on the tubing, effecting the data.
Exercise 1C
Some mistakes that could have taken place are mathematical miscalculations while finding the initial and final masses. A piece of potato skin could have been left in the beakers along with the potato. This causes problems in the data tables. Another possible source of error could be that the students did not pat dry the potato sample well enough and increased the masses of the cores. Numerous may have occurred while using the electronic balance.
Exercise 1D
In this part of the lab, only calculations were made. Simple mathematical errors are bound to occur in this section of the lab.
Exercise 1E
In part 1E, after adding the NaCl solution to the onion cells, the cells should have reduced in size, but no reaction appeared to take place. This may have occurred in part because the onion itself was already dried out and dehydrated, or while the onion was being looked at through the microscope, the heat from it may have caused the cells to loose water. Another possibility is that the reaction took place so quickly that those witnessing could not see it.
Discussion and Conclusion:
Exercise 1A
The data shows what molecules can and cannot diffuse across a selectively permeable membrane. The color change showed that the Iodine Potassium Iodide was small enough to pass through the pores of the membrane. It is shown that the water and glucose solution moved out of the dialysis bag because water is small enough to pass through the membrane and the Testape tested positive for glucose inside the beaker. The glucose started out inside the bag and tested negative with the Testape inside the beaker before the immersion.
Exercise 1B
It can be concluded from the results gathered during the experiment that sucrose cannot pass through the selectively permeable membrane, but instead water molecules must move across the membrane to the area of lower water potential to reach dynamic equilibrium.
Exercise 1C
The results provided information that leads us to conclude that potatoes do contain sucrose molecules. This is known because the cores took in water while they were emerged in the distilled water. This means they had a lower water potential and higher solute potential than the distilled water.
Exercise 1D
The calculations made it evident that all of the results could be determined and proven correct with the simple equations and formulas. Performing these mathematical computations helped give a better understanding of water and solute potential.
Exercise 1E
This particular part of the lab illustrated the shrinking of the plasma membrane from the cell wall in a plant cell, or, in other words, plasmolysis. It shows how plant cells react in a hypertonic environment, the NaCl solution. The turgor pressure decreases as water leaves the cell. This shows how the onion cells had high water potential so water moved to the area outside the cell with lower water potential. Then, after adding water back to the cells, water moved back into the cells, restoring turgor pressure.
Overall
Water potential and concentration gradients are the two phenomenons that effected the results of the experiments. There are many important facts pertaining to water potential. Water potential is used by botanists to determine the movement in and out of a cell. It is effected by two components, pressure and solute potential. Water moves from areas of higher water potential (higher free energy and more water molecules) to areas of lower water potential (lower free energy and less water molecules). Water diffuses down a water potential gradient. Pure water has an atmospheric pressure of zero which is important when using the formula ψs = -iCRT. Water potential is inversely proportional to solute potential. These facts led to or effected the results gained in each section of the lab.
In plant and animal cells, loss or gain of water can have different effects. In an animal cell, it is ideal to have an isotonic solution. If the solution is hypertonic, the cell will shrivel from lack of water intake. Inversely, if the solution is hypotonic the cell could take in too much water and the cell will lyse and break open. For a plant cell, the ideal solution is a hypotonic solution because the cell takes in water increasing turgor pressure. Turgor pressure is important for plant support and maintaining shape. If the solution is hypertonic, the cell will plasmolyze and died from lack of water. In an isotonic solution, the plant cell does not have enough turgor pressure to prevent wilting and possible death. The information gained through this lab is important in understanding the effects of different solutions on organisms in our environments, including ourselves.