Mitosis and Meiosis |
 |
Introduction
There are two types of nuclear division, mitosis and meiosis. Mitosis is usually used for the growth and replacement of somatic cells, while meiosis produces the gametes or spores used in an organism’s reproduction.
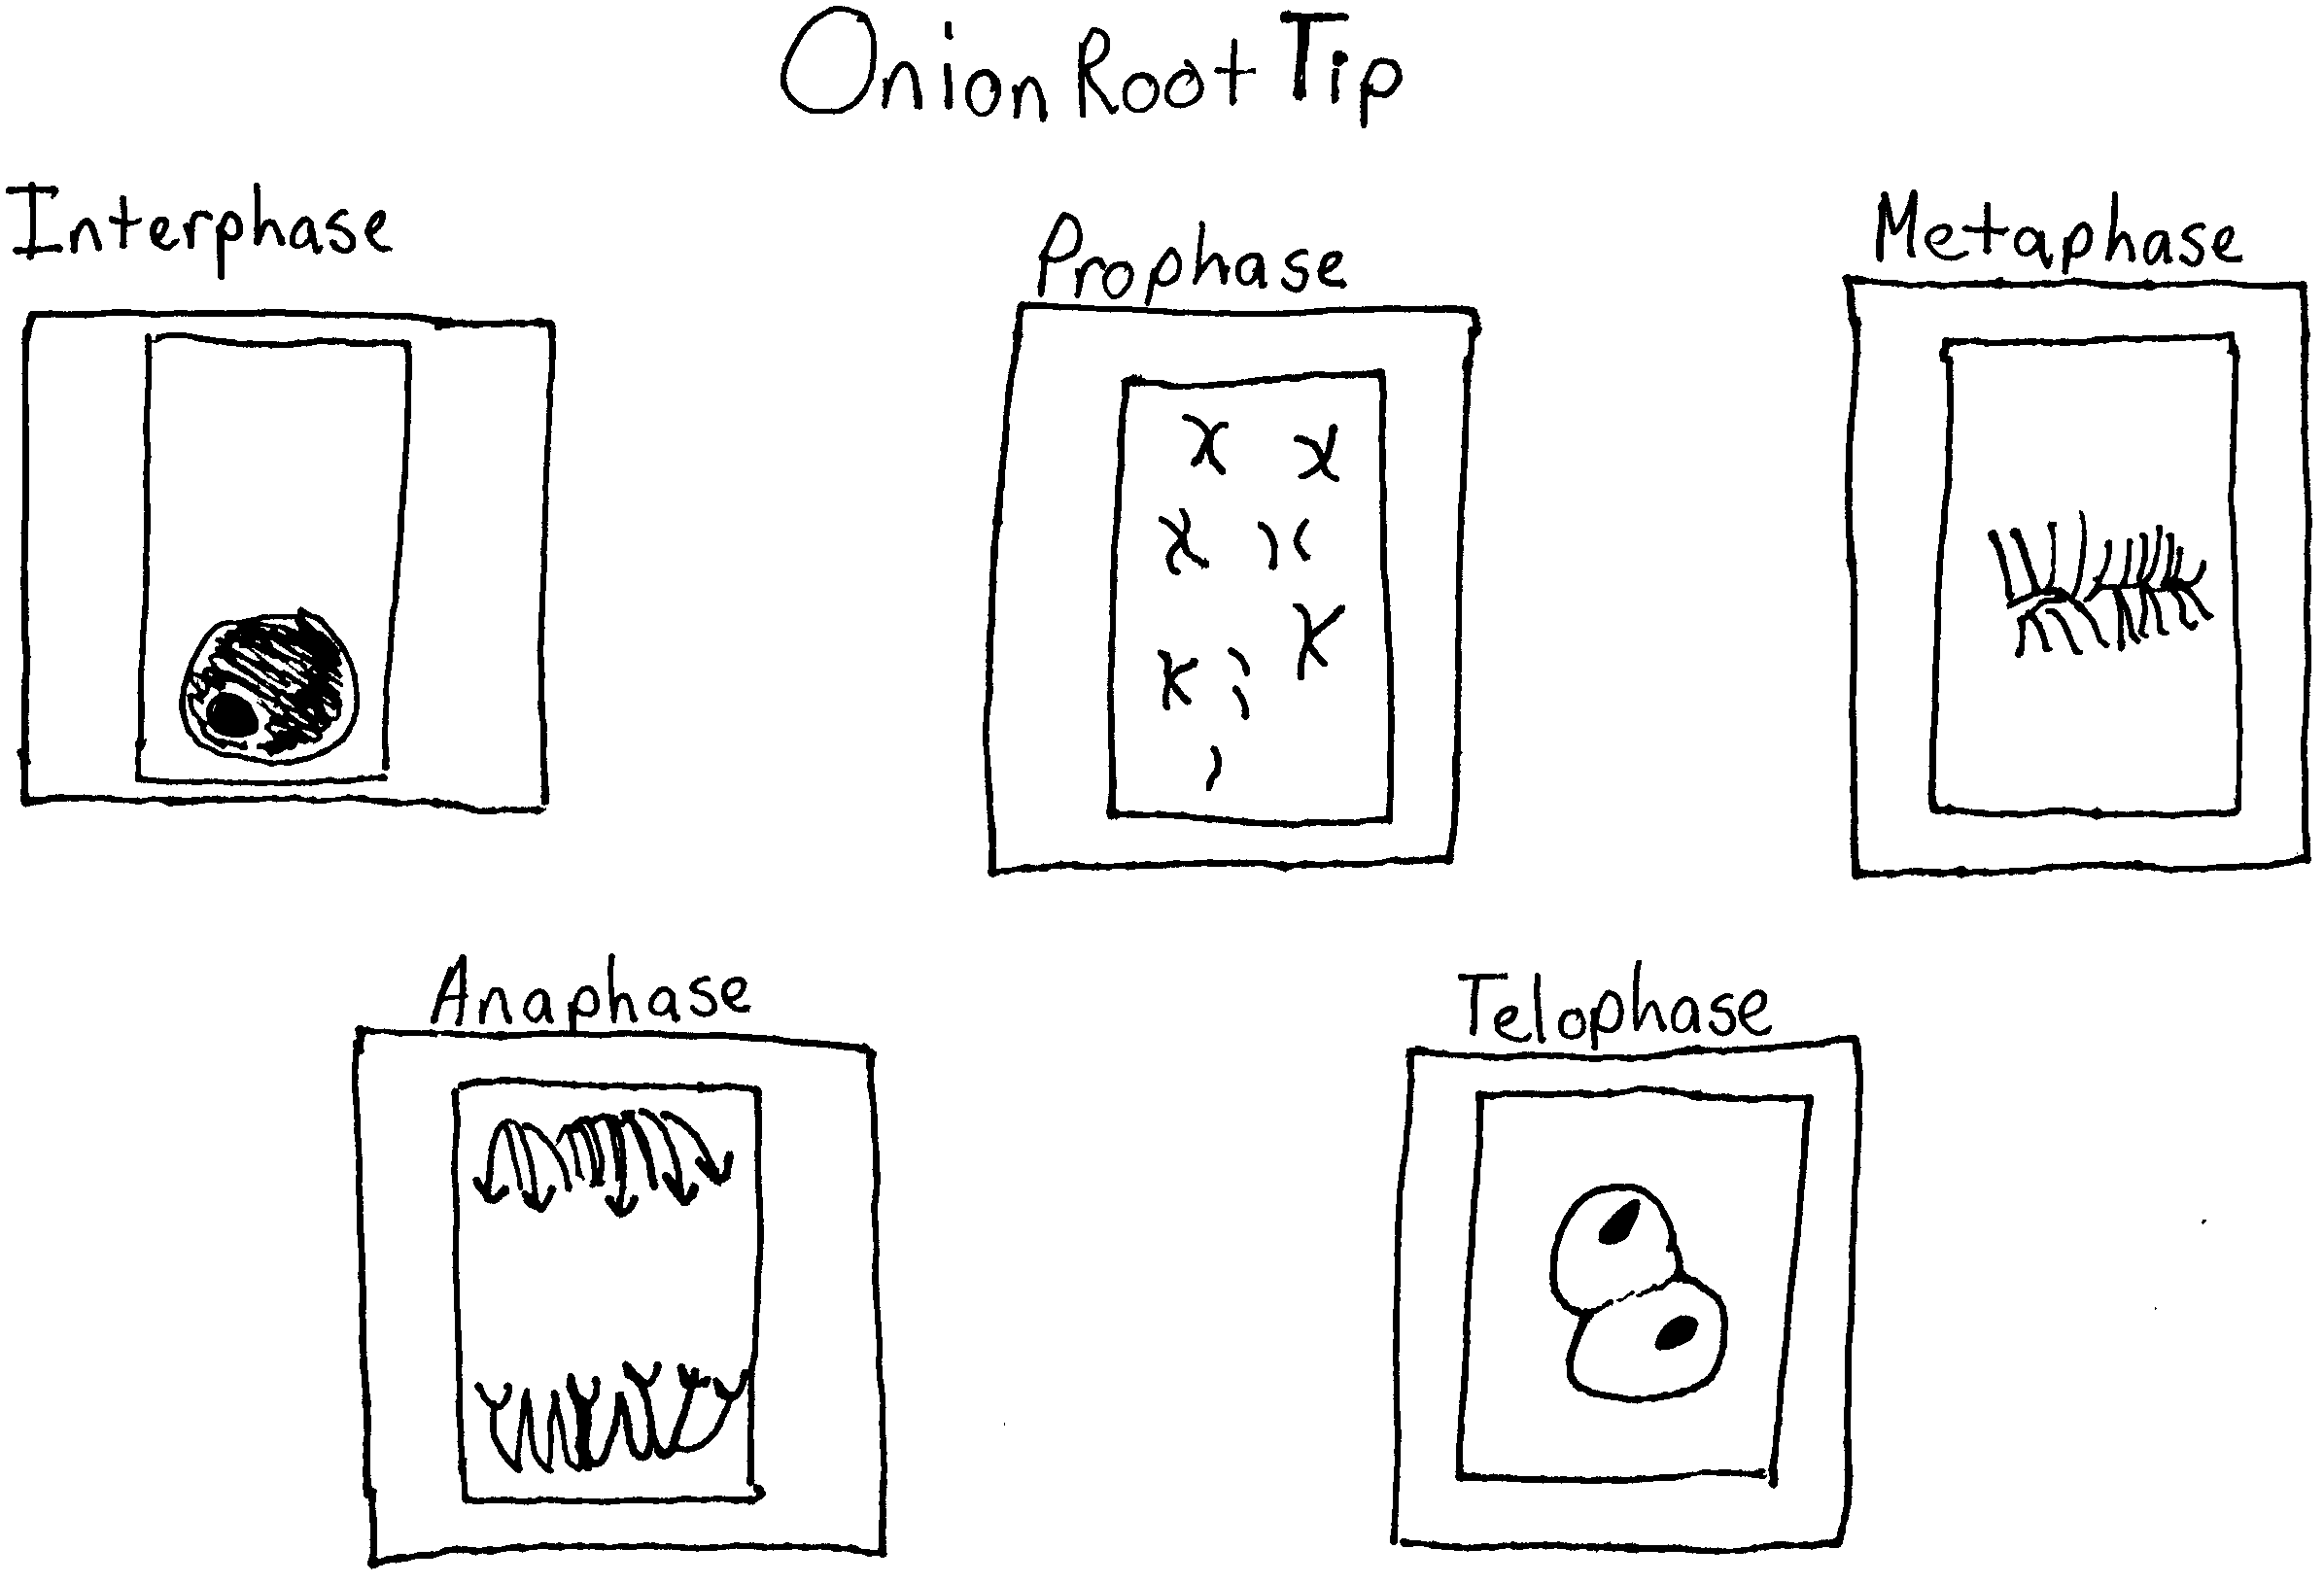
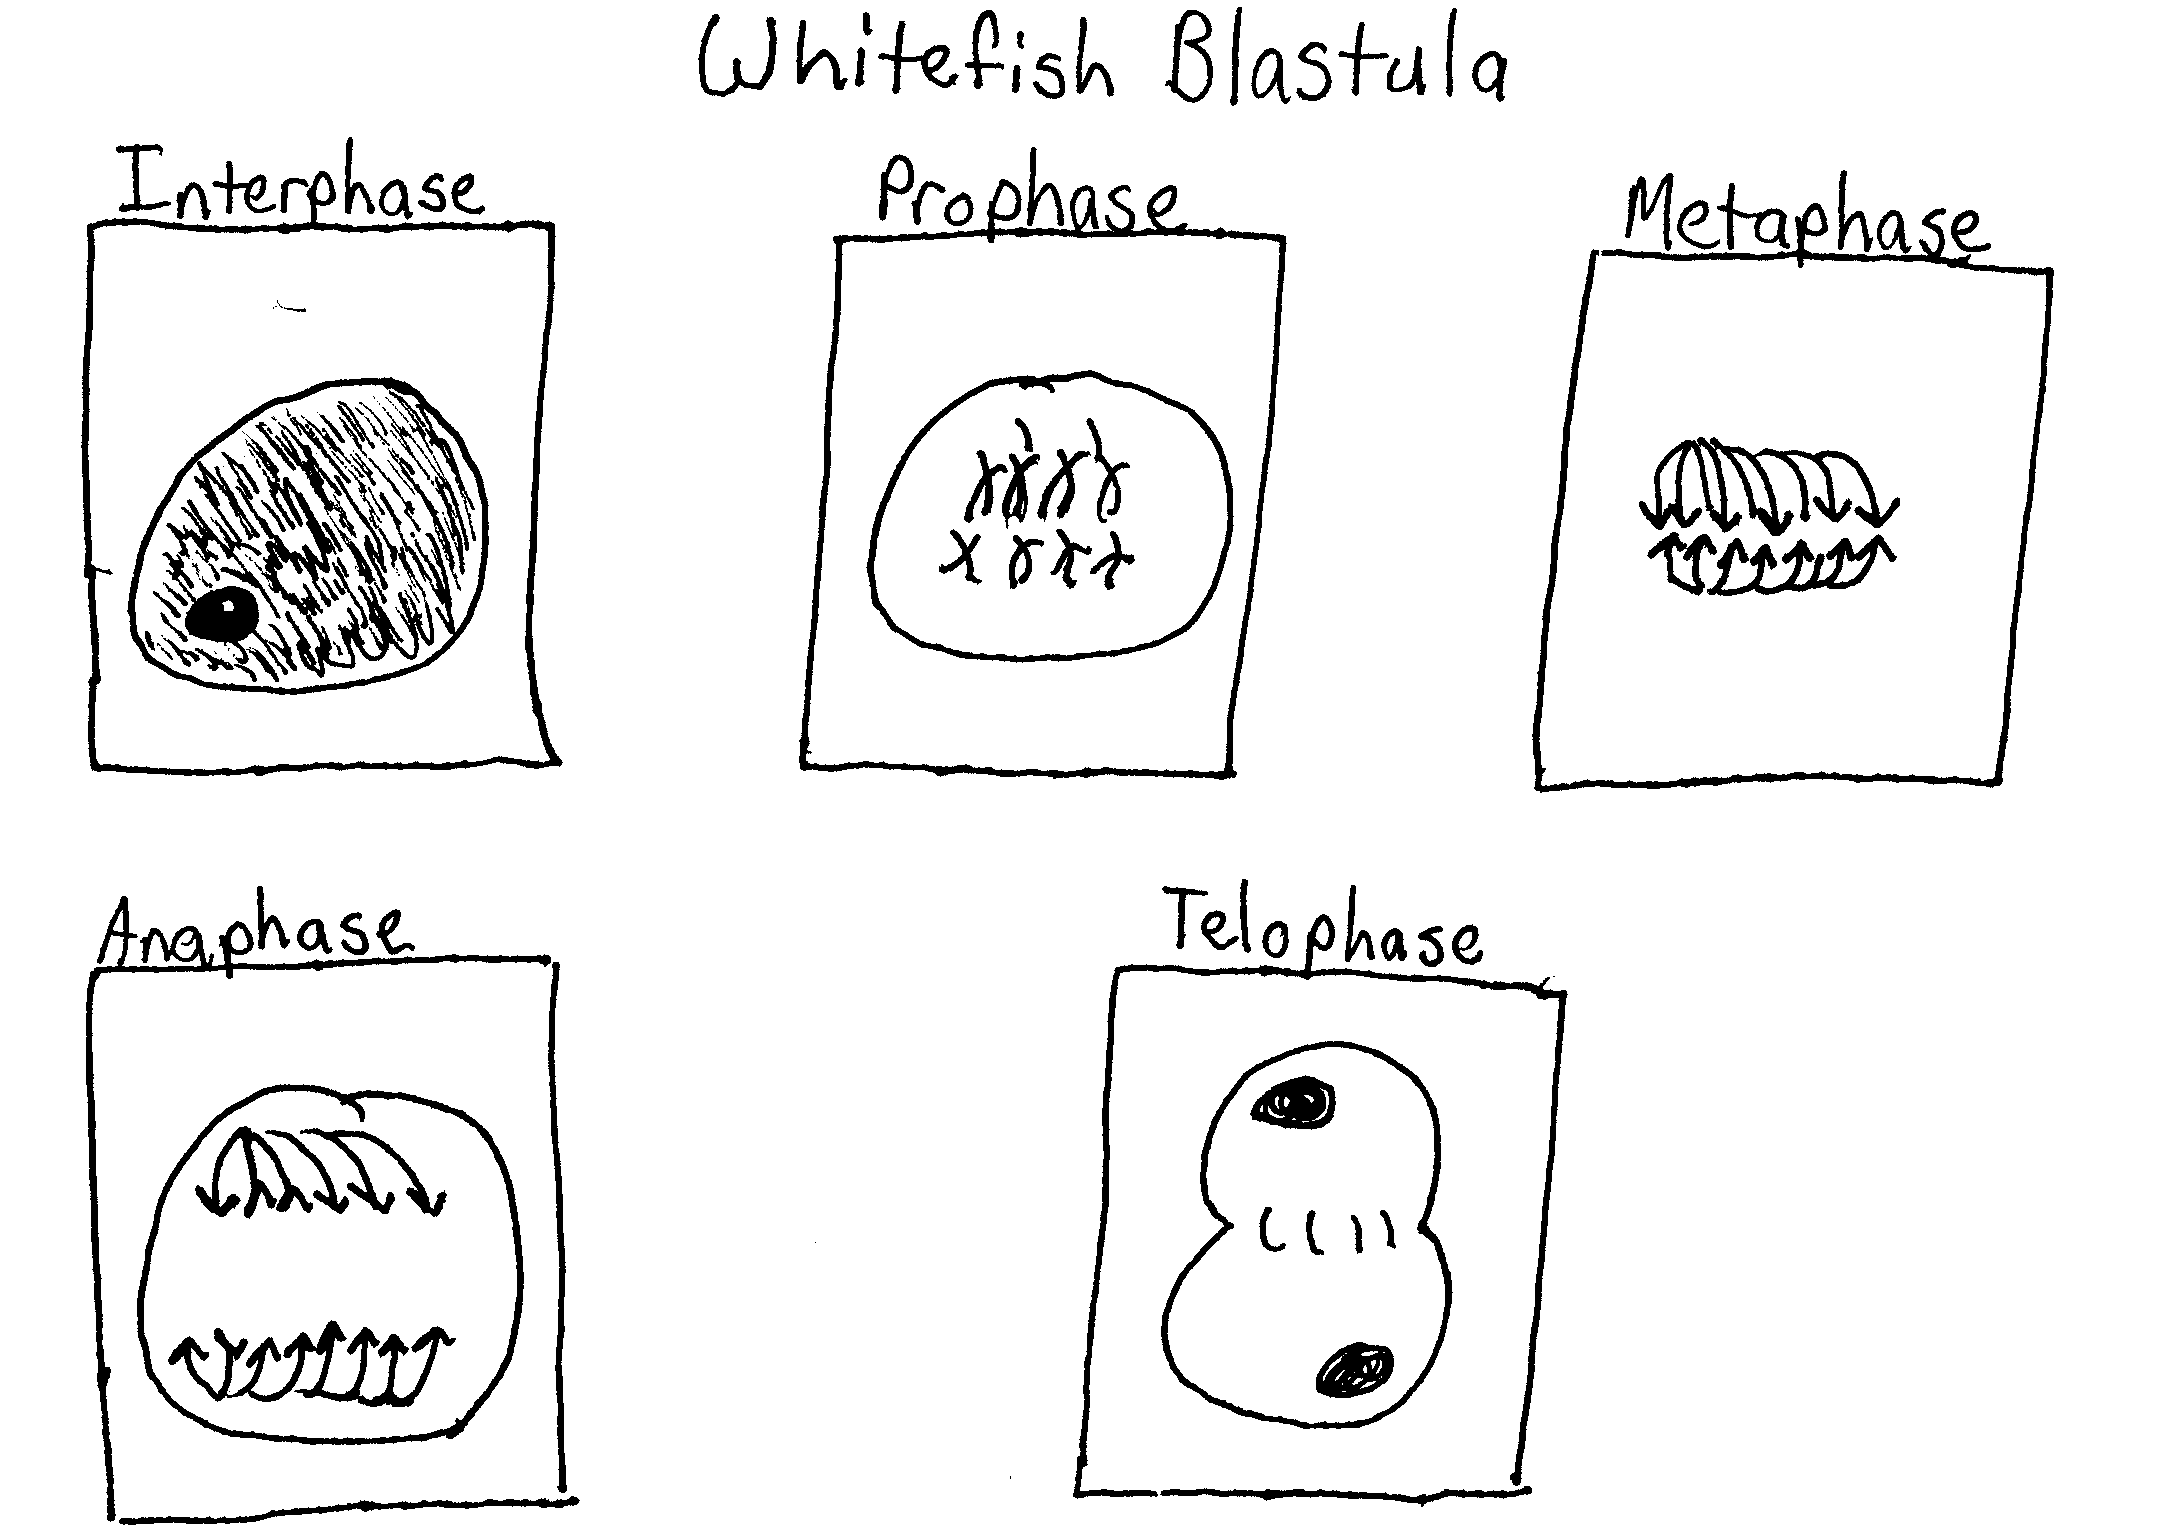
Mitosis is the first of these studied in this lab. It is easily observed in cells that are growing at a rapid pace such as whitefish blastula or onion root tips, which are used in this lab. The root tips contain an area called the apical meristem that has the highest percentage of cells undergoing mitosis. The whitefish blastula is formed directly after the egg is fertilized. This is a period of rapid growth and numerous cellular divisions where mitosis can be observed.
Just before mitosis the cell is in interphase. In this part of the cell cycle the cell will have a distinct nucleus and nucleoli where the thin threads of chromatin are duplicated. After duplication the cell is ready to begin mitosis and its starts with a step called prophase. In prophase, the chromatin thicken into distinct chromosomes and the nuclear envelope breaks open releasing them into the cytoplasm. The first signs of the spindle begin to appear. Next the cell begins metaphase, where the spindle attaches to the centromere of each chromosome and moves them to the same level in the middle of the cell. This level position is called the metaphase plate. Anaphase begins when the chromatids are separated and pulled to opposite poles. Then, the final stage is telophase. The nuclear envelope is reformed and the chromosomes gradually uncoil. Cytokinesis may occur, in which case, a cleavage furrow will form and the two daughter cells will separate.
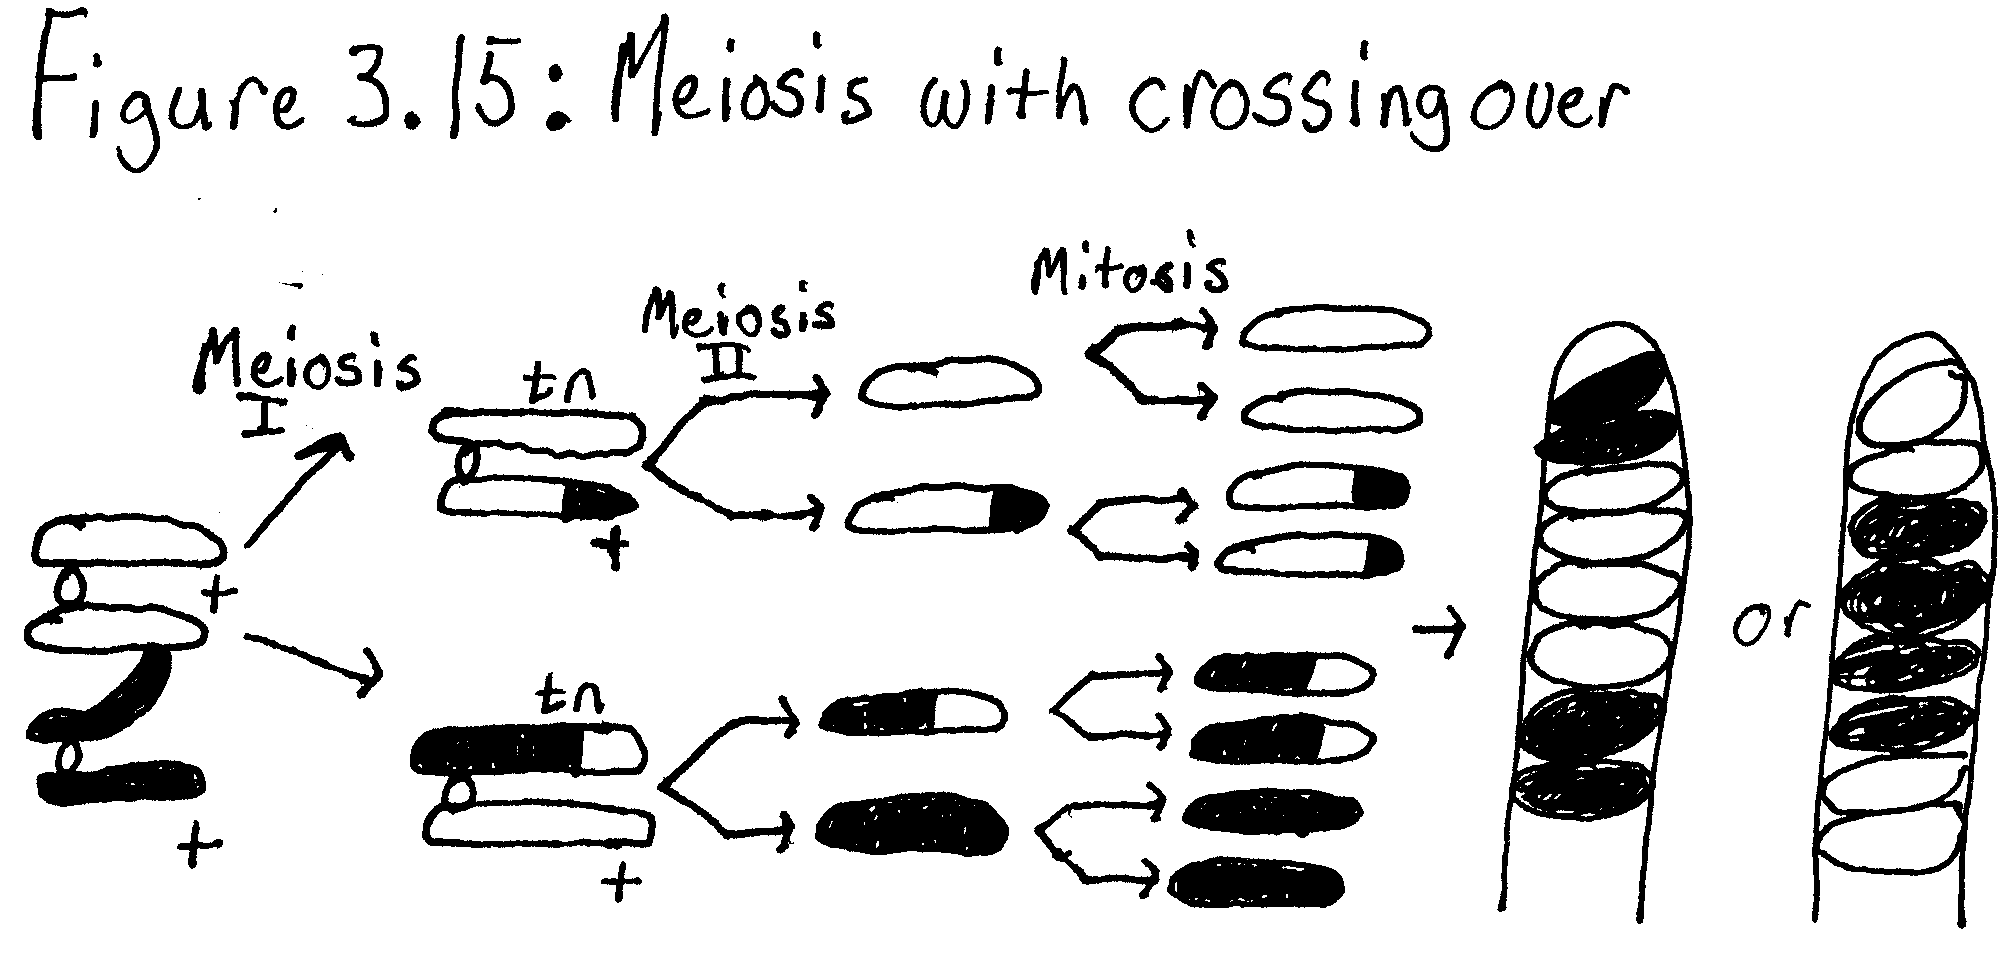
Meiosis is more complex and involves two nuclear divisions. The two divisions are called Meiosis I and Meiosis II and they result in the production of four haploid gametes. This process allows increased genetic variation due to crossing over where genes can be exchanged. The process, like mitosis, depends on interphase to replicate the DNA. Meiosis begins with Prophase I. In this stage, homologous chromosomes move together to form a tetrad and synapsis begins. This is where crossing over occurs resulting in the recombination of genes. Metaphase I moves the tetrads to the metaphase plate in the middle of the cell, and Anaphase I reduces the tetrads to their original two stranded form and moves them to opposite poles. Telophase I then prepares the cell for its second division. Meiosis II generally resembles mitosis except that the daughter cells are haploid instead of diploid. DNA replication does not occur in Interphase II, and prophase, metaphase, anaphase, and telophase occur as usual. The only change is the number of chromosomes.
The process of crossing over can be easily studied in Sordaria fimicola, an ascomycete fungus. Sordaria form a set of eight ascospores called an ascus. They are contained in a perithecium until they are mature and ready for release. Crossing over can be observed in the arrangement and color of these asci. If an ascus has four tan ascospores in a row and four black ascospores in a row (4:4 arrangement), then no crossing over had taken place. However, if the asci has black and tan ascospores in sets of two (2:2:2:2 arrangement) or two pairs of black ascospores and four tan ascospores in the middle (2:4:2 arrangement), then crossing over had taken place.
Hypothesis
Mitosis occurs in whitefish blastula and onion root tip, and it is easily observable. Meiosis and crossing over occurs in the production of gametes and spores.
Materials
This lab requires prepared slides of whitefish blastula, onion root tips, and Sordaria, pencil, paper, a light microscope, and a chromosome simulation kit.
Methods
Exercise 3A.1: Observing Mitosis
Prepared slides of whitefish blastula and onion root tips were observed under the 10X and 40X objectives. A cell in each stage of mitosis were identified, and then sketched.
Exercise 3A.2: Time for Cell Replication
Using a high power objective, every cell in a field of view was observed. Each cell was counted as being in one of the stages of mitosis and recorded. At least 200 cells and 3 fields of vision were counted and recorded. Next, the percentage of cells in each stage was recorded and the amount of time spent in each phase was calculated.
Exercise 3B.1: Simulation of Meiosis
In this part of the lab, a chromosome simulation kit was used to demonstrate meiosis. Two strands of the same color were connected to simulate DNA replication in both of the homologous pairs. Next, the chromosomes were entwined to represent synapsis. Sections of beads were switched between the pairs as in crossing over and were aligned at the equator. Next, anaphase was simulated as the homologous pairs were separated and then telophase was simulated by pushing the chromosomes into two separate cells (circles).
Meiosis II was simulated as well. The DNA is not replicated in Interphase II. The chromosomes again move to the equator and in Anaphase II the two chromatids were separated and moved to opposite poles. Telophase II separates them into four different cells.
Exercise 3B.2: Crossing Over during Meiosis in Sordaria
Prepared slides of Sordaria fimicola were observed under a light microscope. Over 100 asci were identified as either 4:4 or asci showing crossover and recorded. The percentage of each and the map units were calculated.
Results
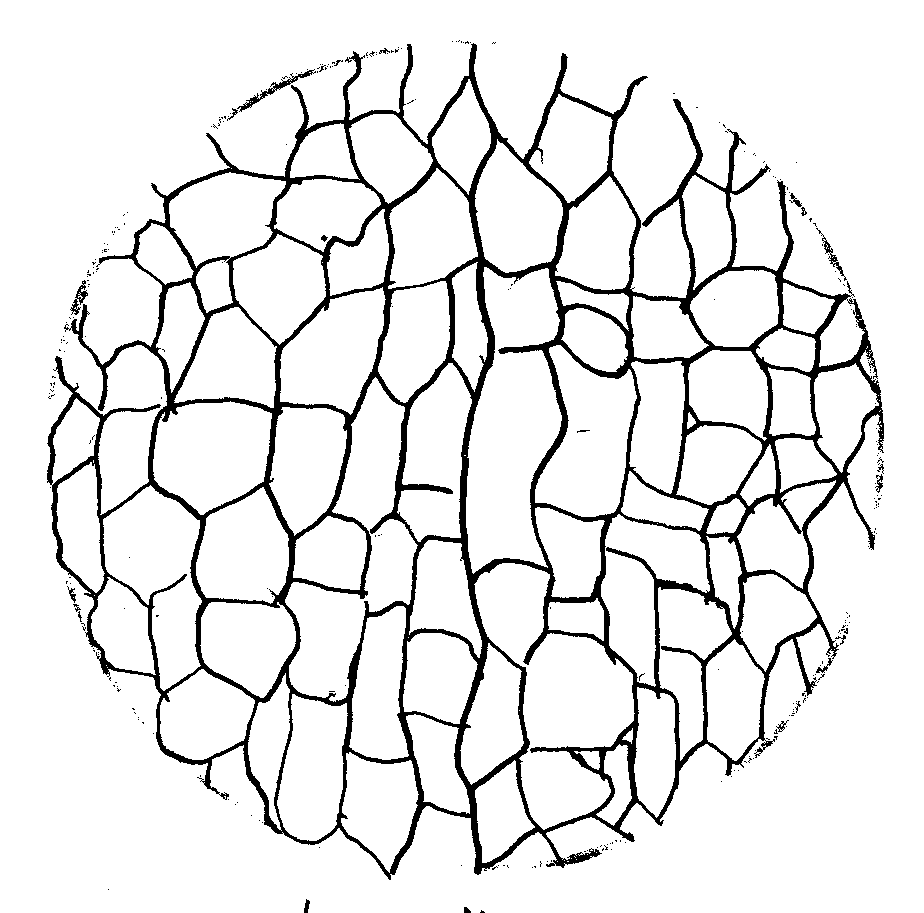
Whitefish Blastula

Onion Root Tip

Table 3.1: Time for Cell Replication
|
Number of Cells |
||||||
| Field 1 | Field 2 | Field 3 | Total | |||
|
Interphase |
42 | 36 | 47 | 125 | 61.27% | 14 hours 42 minutes |
|
Prophase |
10 | 13 | 18 | 41 | 20.10% | 4 hours 49 minutes |
|
Metaphase |
6 | 5 | 4 | 15 | 7.35% | 1 hour 46 minutes |
|
Anaphase |
2 | 3 | 2 | 7 | 3.43% | 49 minutes |
|
Telophase |
7 | 5 | 4 | 16 | 7.84% | 1 hour 59 minutes |
| 204 | ||||||
Table 3.2: Compare Mitosis and Meiosis
|
Mitosis |
Meiosis |
|
|
Chromosome number of parent cells |
Diploid (2n) | Diploid (2n) |
|
Number of DNA replications |
Once | Once |
|
Number of divisions |
One | Two |
|
Number of daughter cells produced |
Two | Four |
|
Chromosome number of daughter cells |
Diploid (2n) | Haploid (n) |
|
Purpose |
Growth and repair | Production of gametes or spores |
Simulation of the Meiosis I

Table 3.3: Sordaria
|
Number of 4:4 |
Number of Asci Showing Crossover |
Total Asci |
% Asci Showing Crossover Divided by 2 |
Gene to Centromere Distance (Map Units) |
| 53 | 64 | 117 | 27.35% | 27.35 |
Meiosis with Crossing Over – 2:4:2 Arrangement

Questions:
Why is it more accurate to call mitosis “nuclear replication” rather than “cellular division”?
It is more accurate to say “nuclear replication” to describe mitosis because the actual cell splitting occurs in cytokinesis. The whole process of mitosis is a series of steps that split the nucleus into two separate nuclei at opposite poles.
Explain why the whitefish blastula and onion root tips are selected for a study of mitosis.
The blastula is a hollow ball of cells that forms from the fertilization of an egg. Rapid growth occurs and numerous cellular divisions making mitosis in various stages easy to observe. Onion root tips are also a region of high percentage of cells going through mitosis because this is where most of the root growth takes place.
If your observations had not been restricted to the area of the root tip that is actively dividing, how would your results differ?
There would be virtually no cells undergoing division, so many more of the cells observed would have been in interphase where they elongate an differentiate.
Based on the data in Table 3.1, what can you infer about the relative length of time an onion root-tip cell spends in each stage of cell division?
Prophase is the longest stage of mitosis and then going in sequential order each decreases in the length of time it takes to complete.
List three major differences between the events of mitosis and meiosis.
In mitosis, the nucleus is only divided once, while in meiosis the nucleus is divided twice. Another difference is that mitosis produces two identical daughter cells, but meiosis produces up to four different daughter cells. Also, synapsis and crossing over do not take place in mitosis, but do take place in meiosis.
How are Meiosis I and Meiosis II different?
Meiosis I begins with a tetrad and separates the homologous pairs. Meiosis II separates the two sister chromatids.
How do oogenesis and spermatogenesis differ?
Oogenesis produces an egg cell, while spermatogenesis produces sperm cells.
Why is meiosis important for sexual reproduction?
In meiosis the chromosome number is reduced to n so that it can be fertilized. Also, meiosis allows for crossing over, which results in variations in organisms.
Error Analysis
There was little chance for error in this lab. It was mostly observation and sketching. However in Exercise 3A.2, the numbers for telophase were off. The calculations obtained for its time were too high; it should have been the shortest stage of meiosis. This may be caused by misidentifying the stages or counting the daughter cells as two different cells. Misidentification could have caused errors in the other parts of this lab as well.
Discussion and Conclusion
Mitosis was observed and timed in Lab 3A. The stages of mitosis are prophase, metaphase, anaphase, and telophase, prophase being the longest and telophase the shortest. Meiosis was simulated in Lab 3B and then crossing over was observed in Sordaria and the map units were determined. The gene to centromere distance in the Sordaria was 27.35 map units.