Ap Lab 1 Sample 5


Osmosis & Diffusion – Lab 1 

Introduction:

All molecules have kinetic energy and are constantly in motion.  This motion causes the molecules to bump into each other and move in different directions.  The result is diffusion.  Diffusion is the random movement of molecules from an area of high concentration to an area of low concentration. This will continue until dynamic equilibrium is reached; no net movement will occur.  Osmosis is a special kind of diffusion.  It is the diffusion of water through a selectively permeable membrane. A selectively permeable membrane means that the membrane will only allow certain molecules through such as water, small solutes, oxygen, carbon dioxide, and glucose, because no additional ATP is required. The membrane will not let ions, nonpolar molecules, or large molecules through because extra ATP is needed for them to travel across the membrane.  Active transport is how molecules (such as ions) move against the concentration gradient.  Additional ATP is required to perform this process.

Water will travel from an area of high water potential to an area of low water potential.  Water potential is the measure of free energy of water in a certain solution.  It is measured by using the Greek letter psi (ψ).  The formula for figuring water potential is:

ψ          =             ψp             +           ψs

Water Potential   =   Pressure Potential   +  Solute Potential

Water potential is affected by 2 different factors.  They are the addition of a solute and the pressure potential.  If a solute is added to the water, then the water potential is lowered.  If more pressure is placed on the water, then the potential is raised. The addition of a solute and water potential are inversely proportional.  Pressure being placed onto the water and the potential of the water are directly proportional.

Solutions can have three relationships with each other; isotonic, hypertonic, or hypotonic.  When the solutions have the same concentration of solutes, they are isotonic.  There is no net change in the amount of water on each side of the membrane.  If the solutions differ in their solute concentrations, the solution that has the most solute is hypertonic to the other solution.  The solution with the smaller amount of solute is hypotonic to the other solution. The net movement of water will be from the hypertonic solution to the hypotonic solution. Net movement will occur until dynamic equilibrium is reached, then there will be no net movement of water.

Hypothesis:

In this lab, osmosis and diffusion will occur between the solutions of different concentration until dynamic equilibrium is reached and there is no net movement of water.

Materials:

Exercise 1A:

The materials used include a 30cm piece of 2.5cm dialysis tubing, string, scissors, 15mL of 15% glucose/1% starch solution, 250mL beaker, distilled water, and 4mL of Lugol’s solution (Iodine Potassium-Iodine or IKI).

Exercise 1B:

This exercise required six 30cm strips of presoaked dialysis tuning, six 250mL cups or beakers, string, scissors, a balance, and 25mL of  these solutions: distilled water, 0.2M sucrose, 0.4M sucrose, 0.6M sucrose, 0.8M sucrose, and 1.0M sucrose.

Exercise 1C:

The materials that were required include 100mL of these solutions: distilled water, 0.2M sucrose, 0.4M sucrose, 0.6M sucrose, 0.8M sucrose, and 1.0M sucrose, six 250mL beakers or cups, a potato, a cork borer, a balance, paper towel, and plastic wrap.

Exercise 1D:

The materials used include a calculator, and a pencil.

Procedure:

Exercise 1A:

Soak the dialysis tubing in water.  Tie off one end of the tubing to form a bag.  Open the bag and place the glucose/starch solution in it.  Tie off the other end of the bag, leaving enough room for expansion of the contents in the bag.  Record the color of the solution in Table 1.1.  Next, test the glucose/starch solution for the presence of glucose.  Record the results in Table 1.1.  Fill a 250mL beaker or cup with 2/3 full with distilled water.  Add 4mL of Lugol’s solution to the distilled water and record the color of the solution in Table 1.1.  Test the solution for glucose and record the results in Table 1.1.  Immerse the bag in the beaker of solution.  Allow the beaker and bag to stand for approximately 30 minutes or until you see a distinct color change in the bag and the beaker.  Record the final color of the solution in the bag, and the solution in the beaker, in Table 1.1.  Test the liquid in the beaker and in the bag for the presence of glucose.  Record the results in Table 1.1.

Exercise 1B:

Obtain the six strips of presoaked dialysis tubing and create a bag out of each one by tying off one end.  Pour 25mL of the 6 solutions into separate bags. Tie off the other end of the 6 bags.  Rinse each bag gently with distilled water and blot dry.  Determine the mass of each bag and record it in Table 1.2.  Immerse each bag in one beaker filled will distilled water and label the beaker to indicate the molarity of the solution in the bag.  Let the setups stand for 30 minutes.  Remove the bags from the water.  Carefully blot them dry and determine their masses.  Record them in Table 1.2.  Obtain the other lab groups data to complete Table 1.3.

Exercise 1C:

Pour 100mL of the solutions into a labeled 250mL beaker.  Use a cork borer to cut potato cylinders.  You need 4 cylinders for each cup.  Determine the mass of the 4 cylinders together and record the amount in Table 1.4.  Place the cylinders into the beaker of sucrose solution.  Cover the beaker with plastic wrap to prevent evaporation.  Let it stand overnight.  Remove the cores from the beaker and blot them gently on a paper towel and determine their total mass.  Record the results in Table 1.4.  Calculate the percentage change.  Do this for the individual and class data.  Graph the class average percentage change in mass.

Exercise 1D:

Determine the solute, pressure, and water potential of the sucrose solution.  Then, graph the information that is given about the zucchini cores.

Results:

Exercise 1A:

 Table 1.1


Initial Contents Initial Color Final Color Initial Presence of Glucose Final Presence of Glucose
Bag 15% glucose & 1% starch Cloudy White Purple Yes Yes
Beaker Water & IKI Brown Orange No Yes


  1. Which substances are entering the bag and which are leaving the bag? What evidence supports the answer?  Distilled water and IKI are  leaving and entering.  Glucose is able to leave the bag.
  2. Explain the results that were obtained.  Include the concentration differences and membrane pore size in the discussion.  Glucose and small molecules were able to move through the pores.  Water and IKI moved from high to low concentration.
  3. How could this experiment be modified so that quantitative data could be collected to show that water diffused into the dialysis bag?  You could mass the bag before and after it was placed into the solution.
  4. Based on your observations, rank the following by relative size, beginning with the smallest: glucose molecules, water molecules, IKI molecules, membrane pores, and starch molecules.  Water molecules, IKI molecules, Glucose molecules, Membrane pores, and Starch molecules
  5. What results would you expect if the experiment started with a glucose and IKI solution inside the bag and only starch and water outside?  The glucose and IKI would move out of the bag and turn the starch and water solution purple/blue.  The starch couldn’t move inside the bag because its molecules are too big to pass through the membrane of the tubing.

Exercise 1B:


Table 1.2: Dialysis Bag Results: Individual Data


Contents in dialysis bag Initial mass (g) Final mass (g) Mass difference (g) % Change in mass
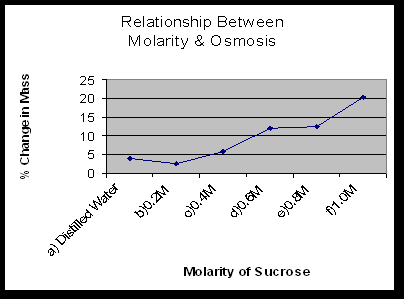
Distilled Water 24.7 23.7 1 4.1
0.2M 26.7 27.4 .7 2.62
0.4M 27.4 29 1.6 5.84
0.6M 25.9 29 3.1 12
0.8M 29 32.6 3.6 12.41
1.0M 28 33.7 5.7 20.4


Table 1.3: Dialysis Bag Results: Class Data


Group 1

Group 2

Group 3

Total Class Average
Distilled Water 4.1% .7% 1.6% 6.4% 2.13%
0.2M 2.62% 6.4% 4.1% 13.12% 4.37%
0.4M 5.84% 9.9% 9.5% 25.24% 8.41%
0.6M 12% 13.4% 9.3% 34.37% 11.57%
0.8M 12.41% 14.6% 15.2% 42.21% 14.07%
1.0M 20.4% 19.7% 15.9% 56% 18.67%


  1. Explain the relationship between the change in mass and the molarity of sucrose within the dialysis bags.  The solute is hypertonic and water will move into the bag.  As the molarity increases the water moves into the bag.
  2. Predict what would happen to the mass of each bag in this experiment if all the bags were placed in a 0.4M sucrose solution instead of distilled water.  Explain.  With the 0.2M bag, the water would move out.  With the 0.4M bag, there will be no net movement of water because the solutions reach dynamic equilibrium.  With the 0.6M-1M bags, the water would move into the bag.
  3. Why did you calculate the percent change in mass rather than simply using the change in mass?  This was calculated because each group began with different initial masses and we would have different data.  All the groups needed consistent data.
  4. A dialysis bag is filled with distilled water and then places in a sucrose solution.  The bag’s initial mass is 20g and its final mass is 18g.  Calculate the percent change of mass, showing your calculations.  ((18-20)/20) x 100 = 10%
  5. The sucrose solution in the beaker would have been hypotonic to the distilled water in the bag.

Exercise 1C


Table 1.4: Potato Core: Individual Data


Contents of Beaker Initial Mass (g) Final Mass (g) Difference in Mass % Change in Mass
Distilled Water 2.8 3.7 .9 32.14
0.2M 2.9 3.1 .2 7
0.4M 2.5 2.2 .3 12
0.6M 2.3 1.9 .4 17.39
0.8M 2.5 1.9 .6 24
1.0M 2.3 1.8 .5 21.74


Table 1.5: Potato Core: Class Data


Group 1 Group 2 Total Class Average
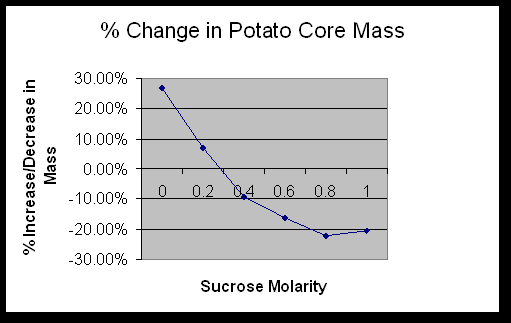
Distilled Water 32.14% 21.1% 53.24% 26.62%
0.2M 7% 6.7% 13.7% 6.85%
0.4M -12% -6.5% -18.5% -9.25%
0.6M -17.39% -15.2% -32.59% -16.30%
0.8M -24% -20% -44% -22%
1.0M -21.74% -19% -40.74% -20.37%


Determine the molar concentration of the potato core.  0.3M

Exercise 1D
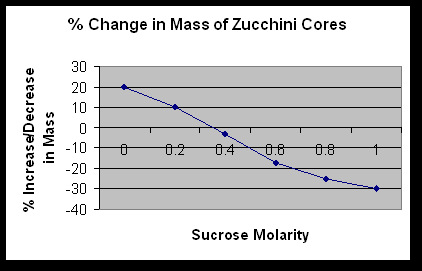


What is the molar concentration of the zucchini cores? .35M


  1. If a potato core is allowed to dehydrate by sitting in the open air, would the water potential of the potato cells decrease or increase? Why?  It would decrease because the water would leave the cells and cause the water potential to go down.
  2. If a plant cell has a lower water potential than its surrounding environment and if pressure is equal to zero, is the cell hypertonic or hypotonic to its environment? Will the cell gain water or lose water?  It is hypotonic and it will gain water.
  3. The beaker is open to the atmosphere.  What is the pressure potential of the system?  The pressure potential is zero.
  4. Where is the greatest water potential?  In the dialysis bag.
  5. Water will diffuse out of the bag. Why? It is because the water moves from and area of high water potential to an area of lower water potential.
  6. What effect does adding solute have on the solute potential component of that solution? Why?  It makes is more negative.
  7. Consider what would happen to a red blood cell placed in distilled water: a) Which would have the higher concentration of water molecules?  Distilled Water  b) Which would have the higher water potential?  Distilled Water  c)  What would happen to the red blood cell? Why?  It would lyce, because it would take on too much water.

Error Analysis:

Possible errors that could have affected the results of the lab include incorrectly mixing the solutions, ineffectively tying the dialysis tubing, inaccurately measuring , and inaccurately calculating.

Conclusion:

            During Exercise 1A the data that was collected help determine which molecules can and can not move across a cell membrane. Obviously, because of the color change in the bag, the IKI was able to move across the membrane.  It is small enough to fit through the pores in the selectively permeable membrane, along with water.  Starch was too large to move across the membrane. Glucose, as the Benedict’s test proves, was able to move freely along with the water and IKI solution.

In Exercise 1B, it was proven that water moves faster across the cell membrane than sucrose.  The water moved to help reach dynamic equilibrium between the 2 solutions.  The sucrose molecules are too big to move across the membrane as fast as water can.

The data in Exercise 1C showed that the potatoes contained sucrose.  The sucrose in the potato raised the solute potential, which lowered the water potential.  The beaker of distilled water had a high water potential.  Water moves down the concentration gradient, causing the potato cores to take on water.

Exercise 1D helped better understand the lab with simple algebra equations.  It proved that the data that was collected was correct through mathematics.


AP Unit Cell Cycle Division


OPENERS:

Right Click on Topic & choose “SAVE AS” to Show any of these 5 minute class openers!

CELL CYCLE & MITOSIS

MEIOSIS

TOP  

NOTES:


TOP  

POWERPOINTS:


TOP  

WORKSHEETS & INTERACTIVES:


TOP  

LABS:


TOP  

TEST PREP:


TOP  

GREAT LINKS:

  • Cell Division: Binary Fission and Mitosis This site, from the University of Arizona, is an illustrated lecture place on mitosis and cell division. It contains many diagrams that may help you understand all the process of cell division.
  • Studying Cells  Introduce yourself to the cell as the fundamental unit of life and the scientific method.
  • The Cell Cycle & Mitosis  Understand the events that occur in the cell cycle and the process of mitosis that divides the duplicated genetic material creating two identical daughter cells.
  • Mitosis Animation Although the diagrams here are somewhat rough, they do a good job of showing the essential features of mitosis. Just remember that the figures show the nucleus, not the entire cell!
  • Meiosis Understand the events that occur in process of meiosis that takes place to produce our gametes.
  • Prokaryotes, Eukaryotes, & Viruses Learn about the cells that make up all living systems, their organelles, and the differences between living cells and viruses.
  • The Cytoskeleton Learn that the cytoskeleton acts both a muscle and a skeleton, and is responsible for cell movement, cytokinesis, and the organization of the organelles within the cell.
  • Online Onion Root Tips Estimate the amount of time cell spent in each mitotic phase in this animated cyber-version of the chapter’s lab investigation. After completing this activity, identifying the phases of mitosis will be a snap.
  • Spindle Microtubules These amazing pictures show microtubule organization at interphase and during several stages of mitosis. (The microtubules are stained green, and the DNA is stained blue.)
  • Cytokinesis Movie This site shows a very nice cytokinesis of a mouse cell growing in a dish.
  • Amphibian Embryology This site provides a good overview of how mitosis takes a fertilized egg and produces an animal from it

TOP  


AP Sample 6 Lab 5 – Cellular Respiration


Lab 6 Cellular Respiration


Introduction


Cellular respiration is the release of energy from organic compounds by metabolic chemical oxidation in the mitochondria within each cell. Enzyme mediated reactions are required. The equation for cellular respiration is:

C6H12O6 + 6 O2 à 6 CO2 + 6 H2O + 686 kilocalories of energy/mole of glucose oxidized

Several different measures can be taken from this equation. The consumption of oxygen, which will tell you how many moles of oxygen are consumed during cellular respiration. That is what was measured in this lab. The production of CO2 can also be measured. And of course the release of energy can be measured. Cellular respiration is a catabolic pathway and the mitochondria houses most of the metabolic equipment for cellular respiration. It will break down glucose in what we call an exergonic reaction. Like previously said, the consumption of oxygen molecules will be measured in a gas form. One must know the physical laws of gases when working with them. The laws are summarized by the following equation.

PV=Nrt

Where:

P stands for the pressure of the gas

V is the volume of the gas

n is the number of molecules of gas

R is the gas constant (fixed value)

T is the temperature of the gas ( in K° )

The CO2 produced during cellular respiration will be removed by potassium hydroxide (KOH) and will form a solid potassium carbonate (K2CO3) when the following reaction occurs: CO2 + 2 KOH à K2CO3+ H2O

Since the CO2 is removed, the change in the volume of gas in the respirometer will be directly related to the amount of oxygen consumed. If the water temp and volume stay constant then the water will move toward the region of lower pressure. During respiration, oxygen will be consumed and its volume will be reduced because the CO2 is being converted to a solid. The net result is a decrease in gas volume in the tube and a decrease in pressure of the tube. The vial with beads will detect any atmospheric changes.

Hypothesis

Several different things will affect the rate of O2 consumption. The non germinating peas will have a lower rate than the germinating peas and the coldness of the water will slow the rates.

Materials

The materials used for this lab were: a 100 mL graduated cylinder, 6vials,germinating peas, dry peas, glass beads, 2 water baths, absorbent cotton and non-absorbent cotton, weights, KOH, water, stoppers, pipettes, rubber bands, masking tape, glue, thermometer, ice, a pencil, and paper.

Methods

Set up a 25° C and a 10° C water bath. Ice may be used to obtain 10° C.

Respirometer 1:Obtain a 100 mL graduated cylinder and fill it with 50 mL of H2O.

Drop in 25 germinating peas. Determine the amount of water displaced. Pea volume =11 mL. Take peas out and place on paper towel.

Respirometer 2: refill cylinder with 50 mL of H2O. Drop 25 dry peas into the cylinder. Add glass beads to obtain the same volume that you got in respirometer 1. Remove peas and beads to a paper towel.

Respirometer 3: Add 50 mL of water to the cylinder. Put only beads in to get an equivalent volume to the first 2 respirometers. Put on paper towel when finished. Repeat respirometer 1 steps for respirometer 4. And 2 for 5. And 3 for 6. Listen to your teacher on how and where to set up the respirometers. Now fill your vials with the required items shown in the table and in figure 5.1. Seal the vials after your items have been put in to stop any gas or water leaks. Place a weighted collar onto the bottom of your vials so they will stay submerged in the water baths. During equilibration use masking tape attached to each side of the water baths to hold the respirometers out of water for 7 minutes. Vials 1-3 should be in the 25° C water bath and vials 4-6 should be in the 10° C water bath. Finally submerge totally the respirometers and let them equilibrate for 3 more minutes. Read the water line where the oxygen is and record in intervals of 5 minutes all the way up to 25 minutes. Record in table 5.1.


Results

Table 5.1: Measurement of O2 Consumption by Soaked and Dry Pea Seeds at Room Temperature and 10° C Using Volumetric Methods


Beads Alone

Germinating Peas

Dry Peas and Beads

Reading at time X Diff. Reading at time X Diff. Corrected Diff. Reading at time X Diff. Corrected Diff.
Initial-0 1.35 1.62 1.32
0-5 1.33 .02 1.20 .42 .4 1.32 .0 .02
5-10 1.33 .02 1.12 .50 .48 1.3 .02 .0
10-15 1.32 .03 1.02 .60 .57 1.29 .03 .0
15-20 1.32 .03 .92 .7 .67 1.3 .02 .01
 

Initial-0

1.48 1.37 1.46
 

0-5

1.48 .0 1.15 .22 .22 1.45 .01 .01
 

5-10

1.45 .03 .98 .39 .36 1.44 .02 .01
 

10-15

1.43 .05 .84 .53 .48 1.43 .03 .02
 

15-20

1.41 .07 .70 .67 .6 1.41 .05 .02


In this activity, you are investigating both the effects of germination versus non-germination and warm temperature versus cold temperature on respiration rate. Identify the hypothesis being tested on this activity.
The nongerminating peas will have a slower rate of respiration than the germinating peas and the coldness of the water will slow down the rate as it gets colder.


This activity uses a number of controls. Identify at least three of the controls, and describe the purpose of each.
The three controls are the beads in one vial controlling the barometric pressure, the KOH keeps equality in the consumption of CO2, and the time intervals give each vial the same amount of time so the results will not be affected.

Describe and explain the relationship between the amount of oxygen consumed and time.
The relationship was pretty constant, there may have been a gradual rising in O2 consumption.

5.


Condition


Calculations


Rate in mL O2/ minute


Germinating Peas/ 10 oC


(1.62-.92)

20

.035
 

Germinating Peas/ 20 oC


(1.37-.7)

20

.0335
 

Dry Peas/ 10 oC


(1.32-1.30)

20

.001
 

Dry Peas/ 20 oC

(1.46-1.41)

20

.0025


Why is it necessary to correct the readings from the peas with the readings from the beads?
The beads were just a control, experiencing no gas change.


Explain the effects of germination (versus non-germination) on pea seed respiration.
The germinating seeds had a higher metabolic rate and therefore consumed more oxygen than the nongerminating.

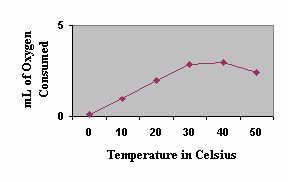
Above is a sample graph of possible data obtained for oxygen consumption by germinating peas up to about 8 oC. Draw in predicted results through 45 oC. Explain your prediction.
Once the temperature gets above about 30 degrees C, the enzymes will denature and that will be the end of respiration.


What is the purpose of KOH in this experiment?
The KOH will take the CO2 and turn it to a precipitant at the bottom of the vial and it will have no affect on the O2 readings.


Why did the vial have to be completely sealed under the stopper?
The vial had to be sealed or gas would leak out and water could leak in and affect the results.


If you used the same experimental design to compare the rates of respiration of a 35g mammal at 10 oC, what results would you expect? Explain your reasoning.
Respiration would be higher in the mammal because they are warm-blooded.


If respiration in a small mammal were studied at both room temperature (21 oC) and 10 oC, what results would you predict? Explain your reasoning.
The rate of respiration would be higher in the 21-degree bath because the mammal would perform better when its body was more comfortable.


Explain why water moved into the respirometer pipettes.
The water moved in the vial because it was fully submerged in water but it came to a stop when it met the oxygen coming out of the vial.

14. Design an experiment to examine the rates of cellular respiration in peas that have been germinating for 0, 24, 48, and 72 hours. What results would you expect? Why?
You could put peas in vials each from a time interval above. You would have a vial with just started germinating peas, one with 24 hour germinating peas, another with 48 hour peas, and the last with 72 hour peas. Place them in a room temp water bath. Take readings at intervals of 5 min up to 20 min. The 72-hour peas should have more O2 consumption because they will use more oxygen because they have been germinating the longest. The just started germinating peas would use the least O2 because they haven’t been germinating vary long. The other two will be in the middle of the “just started peas” and the “72 hour peas”.


Error Analysis


Many errors could have been made in this lab. There could have been miscalculations when trying to equal the pea volumes. The stoppers might not have been sealed and gas could have been lost from the vials affecting the results with vengeance. The water temperatures had to be maintained precisely or the results would not be what they should be. There was also a lot of math in this lab when figuring results and many numbers could have been affected by this poor math.


Disussion and Conclusion

This lab showed many things about thew rates of cellular respiration. This lab showed that germinating peas consume more O2 than nongerminating peas. The colder temperature also slowed the rate of oxygen consumption. The oxygen could be clearly seen because of the following reaction

CO2+2KOH à K2O3 +H2O

This reaction gets rid of the CO2 so that it would not affect the readings of oxygen. It is absorbed by KOH to give you a precipitant K2CO3 + H2O. I conclude that the rate of O2 consumption is directly proportional to the respiration rate in that when the rate increases the gas consumption increases. When the gas consumption is low then the rate is low. Organisms go through cellular respiration more proficiently when the body of the organism is comfortable with its outside temp and environment. This lab showed many things affecting the rate of cellular respiration.

BACK


AP Sample 5 Lab 5 Cellular Respiration


Lab 5     Cellular Respiration


Introduction:


Cellular respiration is an ATP-producing catabolic process in which the ultimate electron acceptor is an inorganic molecule, such as oxygen. It is the release of energy from organic compounds by metabolic chemical oxidation in the mitochondria within each cell. Carbohydrates, proteins, and fats can all be metabolized as fuel, but cellular respiration is most often described as the oxidation of glucose, as follows:

C6H12O6 + 6O2 → 6CO2 + 6H2O + 686 kilocalories of energy/mole of glucose oxidized

Cellular respiration involves glycolysis, the Krebs cycle, and the electron transport chain. Glycolysis is a catabolic pathway that occurs in the cytosol and partially oxidizes glucose into two pyruvate (3-C). The Krebs cycle is also a catabolic pathway that occurs in the mitochondrial matrix and completes glucose oxidation by breaking down a pyruvate derivative (Acetyl-CoA) into carbon dioxide. These two cycles both produce a small amount of ATP by substrate-level phosphorylation and NADH by transferring electrons from substrate to NAD+ (Krebs cycle also produces FADH2 by transferring electrons to FAD). The electron transport chain is located at the inner membrane of the mitochondrion, accepts energized electrons from reduced coenzymes that are harvested during glycolysis and Krebs cycle, and couples this exergonic slide of electrons to ATP synthesis or oxidative phosphorylation. This process produces 90% of the ATP.

Cells respond to changing metabolic needs by controlling reaction rates. Anabolic pathways are switched off when their products are in ample supply. The most common mechanism of control is feedback inhibition. Catabolic pathways, such as glycolysis and the Krebs cycle, are controlled by regulating enzyme activity at strategic points. A key control point of catabolism is the third step of glycolysis, which is catalyzed by an allosteric enzyme, phosphofructokinase. The ratio of ATP to ADP and AMP reflects the energy status of the cell, and phosphofructokinase is sensitive to changes in this ratio. Citrate and ATP are allosteric inhibitors of phosphofructokinase, so when their concentration rise, the enzyme slows glycolysis. As the rate of glycolysis slows, the Krebs cycle also slows since the supply of Acetyl-CoA is reduced. This synchronizes the rates of glycolysis and the Krebs cycle. ADP and AMP are allosteric activators for phosphofructokinase, so when their concentrations relative to ATP rise, the enzyme speeds up glycolysis, which speeds of the Krebs cycle.

Cellular respiration is measure in three manners: the consumption of O2 (how many moles of O2 are consumed in cellular respiration?), production of CO2 (how many moles of CO2 are produced in cellular respiration?), and the release of energy during cellular respiration.

PV = nRT is the formula for the inert gas law, where P is the pressure of the gas, V is the volume of the gas, n is the number of molecules of gas, R is the gas constant, and T is the temperature of the gas in degrees K. This law implies several important things about gases. If temperature and pressure are kept constant then the volume of the gas is directly proportional to the number of molecules of the gas. If the temperature and volume remain constant, then the pressure of the gas changes in direct proportion to the number of molecules of gas. If the number of gas molecules and the temperature remain constant, then the pressure is inversely proportional to the volume. If the temperature changes and the number of gas molecules is kept constant, then either pressure or volume or both will change in direct proportion to the temperature.

Hypothesis:


The respirometer with only germinating peas will consume the largest amount of oxygen and will convert the largest amount of CO2 into K2CO3 than the respirometers with beads and dry peas and with beads alone. The temperature of the water baths directly effects the rate of oxygen consumption by the contents in the respirometers (the higher the temperature, the higher the rate of consumption).


Materials:

The following materials are necessary for the lab: 2 thermometers, 2 shallow baths, tap water, ice, paper towels, masking tape, germinating peas, non-germinating (dry) peas, glass beads, 100 mL graduated cylinder, 6 vials, 6 rubber stoppers, absorbent and non- absorbent cotton, KOH, a 5-mL pipette, silicon glue, paper, pencil, a timer, and 6 washers.


Methods:
Prepare a room temperature and a 10oC water bath. Time to adjust the temperature of each bath will be necessary. Add ice cubes to one bath until the desired temperature of 10oC is obtained.

Fill a 100 mL graduated cylinder with 50 mL of water. Add 25 germinating peas and determine the amount of water that is displaced. Record this volume of the 25 germinating peas, then remove the peas and place them on a paper towel. They will be used for respirometer 1. Next, refill the graduated cylinder with 50 mL of water and add 25 non-germinating peas to it. Add glass beads to the graduated cylinder until the volume is equivalent to that of the expanded germinating peas. Remove the beads and peas and place on a paper towel. They will be used in respirometer 2. Now, refill the graduated cylinder with 50 mL of water. Determine how many glass beads would be required to attain a volume that is equivalent to that of the germinating peas. Remove the beads. They will be used in respirometer 3. Then repeat the procedures used above to prepare a second set of germinating peas, dry peas and beads, and beads to be used in respirometers 4,5,and 6.

Assemble the six respirometers by obtaining 6 vials, each with an attached stopper and pipette. Then place a small wad of absorbent cotton in the bottom of each vial and, using the pipette or syringe, saturate the cotton with 15 % KOH. Be sure not to get the KOH on the sides of the respirometer. Then place a small wad of non-absorbent cotton on top of the KOH-soaked absorbent cotton. Repeat these steps to make the other five respirometers. It is important to use about the same amount of cotton and KOH in each vial.

Next, place the first set of germinating peas, dry peas and beads and beads alone in vials 1,2, and 3. Place the second set of germinating peas, dry peas and beads, and glass beads in vials 4,5, and 6. Insert the stoppers in each vial with the proper pipette. Place a washer on each of the pipettes to be used as a weight.


Respirometer Temperature Contents
1 Room Germinating Peas
2 Room Dry Seeds + Beads
3 Room Beads
4 10oC Germinating Peas
5 10oC Dry Seeds + Beads
6 10oC Beads


Make a sling using masking tape and attach it to each side of the water baths to hold the pipettes out of the water during the equilibration period of 10 minutes. Vials 1,2, and 3 should be in the bath containing water at room temperature. Vials 4, 5, and 6 should be in the bath containing water that is 10oC. After the equilibration period, immerse all six respirometers into the water completely. Water will enter the pipette for a short distance and stop. If the water does not stop, there is a leak. Make sure the pipettes are facing a direction from where you can read them. The vials should not be shifted during the experiment and your hands should not be placed in the water during the experiment.

Allow the respirometers to equilibrate for three more minutes and then record the initial water reading in each pipette at time 0. Check the temperature in both baths and record the data. Every five minutes for 20 minutes take readings of the water’s position in each pipette, and record.


Results:

Table 1: Measurement of O2 Consumption by Soaked and Dry Pea Seeds at Room Temperature and 10˚C Using Volumetric Methods


Beads Alone

Germinating Peas

Dry Peas and Beads


Reading at time X


Diff.


Reading at time X


Diff.


Corrected Diff.∆


Reading at time X


Diff.


Corrected Diff.∆


Initial-0

1.38 1.35 1.47
 

0-5

1.38 0 1.16 .19 .19 1.46 .01 .01
 

5-10

1.38 0 1.04 .31 .31 1.44 .03 .03
 

10-15

1.38 0 0.93 .42 .42 1.43 .04 .04
 

15-20

1.38 0 0.57 .78 .78 1.42 .05 .05
 

Initial-0

1.40 1.32 1.40
 

0-5

1.39 .01 1.20 .12 .11 1.40 0 .01
 

5-10

1.38 .02 1.11 .21 .19 1.40 0 .02
 

10-15

1.38 .02 1.00 .32 .30 1.39 .01 .01
 

15-20

1.38 .02 0.95 .37 .93 1.38 .02 0


In this activity, you are investigating both the effects of germination versus non-germination and warm temperature versus cold temperature on respiration rate. Identify the hypothesis being tested on this activity. The rate of cellular respiration is higher in the germinating peas in cold than in the beads or non-germinating peas; the cooler temperature in the cold water baths slows the process of cellular respiration in the both germinating and non-germinating peas.

This activity uses a number of controls. Identify at least three of the controls, and describe the purpose of each. The constant temperature in the water baths yielding stable readings, the unvarying volume of KOH from vial to vial leading to equal amounts of carbon dioxide consumption, identical equilibration periods for all the respirometers, precise time intervals between measurements, and glass beads acting as a control for barometric pressure all served as controls.


Describe and explain the relationship between the amount of oxygen consumed and time. There was a constant, gradual incline in the amount of oxygen consumed over precise passage of time.


Condition


Calculations


Rate in mL O2/ minute


Germinating Peas/ 10 oC


(1.40-1.38)

20 min.

.001
 

Germinating Peas/ 20 oC


(1.35-.57)

20 min.

.040
 

Dry Peas/ 10 oC


(1.40-1.38)

20 min.

.001
 

Dry Peas/ 20 oC

(1.47-1.42)

20 min.

.003


Why is it necessary to correct the readings from the peas with the readings from the beads? The beads served as a control variable, therefore, the beads experienced no change in gas volume.


Explain the effects of germination (versus non-germination) on pea seed respiration. The germinating seeds have a higher metabolic rate and needed more oxygen for growth and survival. The non-germinating peas, though alive, needed to consume far less oxygen for continued subsistence.

Above is a sample graph of possible data obtained for oxygen consumption by germinating peas up to about 8 oC. Draw in predicted results through 45 oC. Explain your prediction. Once the temperature reached a certain point, the enzymes necessary for cellular respiration denatured and germination (and large amounts of oxygen consumption) was inhibited.


What is the purpose of KOH in this experiment? The KOH drops absorbed the carbon dioxide and caused it to precipitate at the bottom of the vial and no longer able to effect the readings.


Why did the vial have to be completely sealed under the stopper? The stopper at the top of the vial had to be completely sealed so that no gas could leak out of the vial and no water would be allowed into the vial.


If you used the same experimental design to compare the rates of respiration of a 35g mammal at 10 oC, what results would you expect? Explain your reasoning. Respiration would be higher in the mammal since they are warm-blooded and endothermic.


If respiration in a small mammal were studied at both room temperature (21 oC) and 10 oC, what results would you predict? Explain your reasoning. Respiration would be higher at 21 degrees because it would be necessary for the animal to maintain a higher body temperature. The results would proliferate at 10 degrees because the mammal would be required to retain its body temperature at an even lower temperature in comparison to room temperature.


Explain why water moved into the respirometer pipettes. While the peas underwent cellular respiration, they consumed oxygen and released carbon dioxide, which reacted with the KOH in the vial, resulting in a decrease of gas in the pipette. The water moved into the pipette because the vial and pipette were completely submerged into the bath.


Design an experiment to examine the rates of cellular respiration in peas that have been germinating for 0, 24, 48, and 72 hours. What results would you expect? Why? Respirometers could be set up with respirometer 1 containing non-germinating peas, respirometer 2 holding peas that have been germinating 24 hours, 3 would contain the peas that germinated 48 hours, and 4 would hold the peas that germinated 72 hours. All the respirometers should have the KOH added to the bottom in the same manner as in lab described earlier. The respirometers should be placed in baths with the same temperature for all the respirometers. The seeds that have not begun germination would consume very little oxygen. The peas that have been germinating for 72 hours will have the greatest amount of oxygen consumption, while the other two samples will consume a medium (in comparison to respirometers 1 and 4 results) amount of oxygen.


Error Analysis:


Numerous errors could have occurred throughout the lab. The temperature of the baths may have been allowed to fluctuate, the amounts of peas, beads, KOH, and cotton may have varied from vial to vial damaging the results, and these problems would have occurred only during set up. Air may have been allowed to creep into the vial via a leaky stopper or poorly sealed pipette. Timing for the equilibration of the respirometers and the five-minute time intervals may have been erroneous. It was somewhat difficult to read the markings on the pipettes and so errors are always likely. Mathematical inaccuracies may have taken place when filling out the table and finding the corrected difference by using the formula provided.


Discussion and Conclusion:


The lab and the results gained from this lab demonstrated many important things relating to cellular respiration. It showed that the rates of cellular respiration are greater in germinating peas than in non-germinating peas. It also showed that temperature and respiration rates are directly proportional; as temperature increases, respiration rates increase as well. Because of this fact, the peas contained by the respirometers placed in the water at 10 oC carried on cellular respiration at a lower rate than the peas in respirometers placed in the room temperature water. The non-germinating peas consumed far less oxygen than the germinating peas. This is because, though germinating and non-germinating peas are both alive, germinating peas require a larger amount of oxygen to be consumed so that the seed will continue to grow and survive.

In the lab, CO2 made during cellular respiration was removed by the potassium hydroxide (KOH) and created potassium carbonate (K2CO3). It was necessary that the carbon dioxide be removed so that the change in the volume of gas in the respirometer was directly proportional to the amount of oxygen that was consumed. In the experiment water will moved toward the region of lower pressure. During respiration, oxygen will be consumed and its volume will be reduced to a solid. The result was a decrease in gas volume within the tube, and a related decrease in pressure in the tube. The respirometer with just the glass beads served as a control, allowing changes in volume due to changes in atmospheric pressure and/or temperature.

BACK


AP Lab 1 Osmosis Sample 4


Diffusion and Osmosis


Introduction:


Atoms and molecules are the building blocks of cells. Both have kinetic energy and are constantly in motion. They continually bump into one another and bounce off into new directions. This action results in two important processes, diffusion and osmosis.

Diffusion is the random movement of molecules from an area of higher concentration of those molecules to an area of lower concentration. Cells have selectively permeable membranes that only allow the movement of certain solutes. Diffusion is vital for many of life’s functions in a cell. It allows oxygen and carbon dioxide exchange in the lungs and between the bodies of intracellular fluid and cells. Diffusion also aids in the transport of nutrients and water in the xylem and phloem of plants. In those plants, it permits for the absorption of water into roots. An example of this process is the diffusion of a smell in a room. Eventually dynamic equilibrium will be reached. This means that the concentration of the molecules carrying the smell will be approximately equal through out the surrounding enclosed area and no net movement of the molecules will occur from one area to another.

Osmosis is special kind of diffusion. It is the diffusion or movement of water through semi-permeable membranes from a region of higher water potential (hypotonic solute) to a region of lower water potential (hypertonic solute). Water potential is the measure of free energy of water in a solution. There are three types of solutions. Isotonic solutions have an equal concentration of solute on both sides of the membrane, and dynamic equilibrium has been reached in the solution. Hypertonic solutions have a higher concentration of solute on one side of the membrane than the other. Hypotonic solutions are the opposite of hypertonic solutions. A solute is what is being dissolved by the solvent (water is the most common solvent) in a solution.

Water will always move from an area of higher water potential to an area of lower water potential. An important factor effecting of diffusion and osmosis is water potential. Water potential measures the tendency of water to leave one place in favor of another place. Water potential is affected by two physical factors. One factor is the addition of solute, which lowers the water potential. The other factor is pressure potential. An increase in pressure raised the water potential. The water potential of pure water at atmospheric pressure is defined as being zero. The Greek letter psi is used to represent water potential. The following formula can be used for calculations:

ψ (Water potential) = ψp (Pressure potential) + ψs (Solute potential)

Movement of water into and out of a cell is influenced by the solute potential on one side of the cell membrane relative to the other side. Plasmolysis is a phenomenon in walled plant cells in which the cytoplasm shrivels and the plasma membrane pulls away from the cell wall when the cell loses water to a hypertonic environment. This leads to a loss of turgor pressure (the force directed against a cell wall after the influx of water and the swelling of a walled cell due to osmosis) and eventual death of the plant. If water moves into the cell, the cell may lyse, or burst (in animal cells, plant cells are equipped to handle large intakes of water). Water movement is directly proportional to the pressure on a system. Pressure potential is usually positive in living cells and negative in dead ones.

Diffusion and osmosis are not the only processes responsible for the movement of ions or molecules in an out of cells. Active transport is process that uses energy from ATP to move substances through the cell membrane. Normally, active transport moves a substance against its concentration gradient, that is to say from a region of low concentration to an area of higher concentration.


Hypothesis:


Osmosis and diffusion will continue until dynamic equilibrium is reached and net movement will no longer occur. Diffusion is effected by the solute size and concen-tration gradient across a selectively permeable membrane. Water potential greatly determines the results in sections of the experiment.


Materials:


Exercise 1A

For this exercise, the following materials are required: a 30 cm of 2.5 cm dialysis tubing, 250 ml beaker, distilled water, funnel, 2 dialysis tubing clamps, 15 ml of 15% glucose/1% starch solution, 4 pieces of glucose tape, 4 ml of Lugol’s solution (Iodine Potassium-Iodide or IKI), a timer, paper and pencil.

Exercise 1B

This exercise of the experiment requires six strips of 30 cm dialysis tubing, 250 ml beaker, 12 dialysis tubing clamps, funnel, six cups, distilled water, an electronic balance, timer, paper towels, and about 25 ml of each of these solutions: distilled water, 0.2 M glucose, 0.4 M glucose, 0.6 M glucose, 0.8 M glucose, and 1.0 M glucose. For recording results, paper and pencil are necessary.

Exercise 1C

This part of the experiment requires a large potato, potato corer (about 3 cm long), 250 ml beaker, paper towels, scale, six cups, knife, paper, pencil and about 100 ml of each of these solutions: distilled water, 0.2 M glucose, 0.4 M glucose, 0.6 M glucose, 0.8 glucose, and 1.0 M glucose.

Exercise 1D

This section requires a calculator, paper, pencil, and graphing paper.

Exercise 1E

This section of the experiment requires paper, pencil, paper towels, onionskin, dye, microscope, slide, cover slip, salt water (15%), and tap water.


Methods:


Exercise 1A

First, soak the dialysis tubing in distilled water for 24 hours. Before handling the tubing, wash dirty hands thoroughly to prevent getting oils on the dialysis tubing and changing the results. Remove the tubing and tie off one end using the clamp. To use the clamp, twist the end of the bag several times and then fold it onto itself. Next, open the other end of the tubing by rubbing the end between two fingers. Fill it with the glucose/starch solution using a funnel. Use the glucose tape by dipping it into the solution. Record the color change of the tape and the color of the bag. Tie of the end with the tubing clamp. It is necessary to leave space for expansion but no air. Fill the beaker with distilled water and add the 4-ml of Lugol’s solution. Record the color change. Use glucose tap to test for any glucose in the water. Record these results. Set the dialysis tubing in the beaker and let it sit for about 30 minutes. Remove the bag and record the change in water and bag color. Use the last two pieces of glucose tape to measure the glucose in the water and bag. Record results.

Exercise 1B

First, soak the dialysis tubing for about 24 hours. Again be sure to cleanse hands. Tie off one end of each tube with the clamps. Next, fill each tube with a different solution (distilled water, 0.2 M glucose, 0.4 M glucose, 0.6 M glucose, 0.8 glucose, and 1.0 M glucose) with the funnel and tie off the end again leaving empty space, but no air. Weigh each bag separately on the electronic balance and record the masses. Soak the bags in separate cups filled with distilled water for about 30 minutes. Remove the bags and gently blot dry with paper towel. Reweigh, and record the mass.

Exercise 1C

First, slice the potato into to 3-cm discs. Use the potato corer to core out 24 cores. Weigh 4 cores together and record their mass. Fill each cup with one of the following solutions: distilled water, 0.2 M glucose, 0.4 M glucose, 0.6 M glucose, 0.8 glucose, and 1.0 M glucose. In each cup put 4 potato cores, and allow them to sit over night. Take out the cores and blot them dry. Again weigh them on the electronic scale. Record the change in mass. Calculate the information for the table. Compare the results with another group.

Exercise 1D

First, determine the solute potential of the glucose solution, the pressure potential, and the water potential. Graph the information given about the zucchini cores.

Exercise 1E

Prepare a wet mount slide of dyed onion skin. Observe under a light microscope and sketch how the cells appear. Add a few drops of the salt solution using a paper towel to wick the solution under the slip. Observe how the cells are effected and make another sketch.


Results:

Exercise 1A


Table 1: Change of Color of Dialysis Tubing and Beaker


Solution Color


Presence of Glucose (Glucose Tape)


Initial


Final


Initial


Final


Dialysis Bag

15% Glucose/1% Starch Milky White Midnight Blue Algae Green Mahogany
 

Beaker

Water + IKI Amber Rusty Amber Pear Green Olive Green


Initial Glucose Tests Final Glucose Tests


Which substance(s) are entering the bag and which are leaving the bag? What experimental evidence supports your answer? Iodine Potassium Iodide and water enter the bag. This is proven by the color change (starch test) and the increase in the size of the bag. Glucose left the bag and this is proven by a positive test on the surrounding water.


Explain the results you obtained. Include the concentration differences and membrane pore size in your discussion. The results show that the water, glucose, and IKI molecules were small enough to pass through the selectively permeable membrane. The starch didn’t leave the beaker because its molecules were too large to pass through the selectively permeable membrane’s pores.


Quantitative data uses numbers to measure observed changes. How could this experiment be modified so that quantitative data could be collected to show that water diffused into the dialysis bag? The bags could be massed before and following their immersion in the solution. The volume of the solution in the beaker could be found before and after the immersion of the bag by using a graduated cylinder.


Based on your observations, rank the following by relative size, beginning with the smallest: glucose molecules, water, IKI, membrane pores, and starch molecules. The smallest substance was water, then the IKI molecules, glucose, the membrane pores, and the largest substance was the starch molecules.


What results would you expect if the experiment started with a glucose and IKI solution inside the bag and only starch and water outside? Why? Based on the size of the molecules, the glucose and IKI would move out of the bag and the water would go in. The large starch molecules would be left in the beaker.

Exercise 1B


Table 2: Dialysis Tubing Mass Change Results: Individual Data


Contents of Dialysis Tubing


Initial Mass (g)


Final Mass (g)


Mass Difference (g)


Percent Change in Mass


a) Distilled Water

26.0 26.2 0.2 .77%
 

b) 0.2 M

27.0 27.5 0.5 1.85%
 

c) 0.4 M

25.0 25.6 0.6 2.4%
 

d) 0.6 M

27.9 31.4 3.5 12.54%
 

e) 0.8 M

28.3 32.0 3.7 13.07%
 

f) 1.0 M

28.4 34.6 4.7 16.55%


Table 3: Dialysis Tubing Mass Change Results: Group Data


Solution


Group 1


Group 2


Group 3


Average


a) Distilled Water

.77% 1.53% .83% 1.04%
 

b) 0.2 M

1.86% 5.30% 1.9% 3.02%
 

c) 0.4 M

2.4% 2.22% 2.2% 2.27%
 

d) 0.6 M

12.54% 9.75% 11.8% 11.36%
 

e) 0.8 M

13.07% 9.64% 12.3% 11.67%
 

f) 1.0 M

16.55% 18.98% 16.9% 17.48%
 

Team Members

Tripp & Stephanie Hudgens & Kris Elizabeth & Julie NA


Graph 1: Percent Change in Mass of Dialysis Tubing in Sucrose Solutions of Different Molarities

Explain the relationship between the change in mass and the molarity of sucrose within the dialysis bags. The molarity is directly proportional to the percent change in mass. As the mass percentage increases, so does the molarity.


Predict what would happen to the mass of each bag in this experiment if all the bags were placed in a 0.4-M sucrose solution instead of distilled water. Explain your response. They are inversely proportional because whenever the sucrose molarity inside the bag is more concentrated, it will become more dilute and vice versa. The solutions will reach equilibrium somewhere between the two concentrations.


Why did you calculate the percent change in mass rather than simply using the change in mass? Each group began with different amounts of solution for their initial mass. Therefore, results cannot be based on those numbers. The differences in mass don’t deal with the proportional aspect of the solutions, making the real results less accurate. The percent was calculated to give the exact difference, along with considering the quantities of solution.


A dialysis bag is filled with distilled water and then placed in a sucrose solution. The bag’s initial mass is 20g, and its final mass is 18g. Calculate the percent change of mass, showing your calculations in the space below. 18g (final mass) – 20g (initial mass) / 20g (initial mass) = 2/20g x 100 = 10% change of mass

Exercise 1C


Table 4: Potato Core: Individual Results


Contents in Beaker


Initial Mass (g)


Final Mass (g)


% Change in Mass

Distilled Water 1.8 2.1 16.7%
0.2 M Sucrose 1.5 1.7 13.3%
0.4 M Sucrose 1.5 1.8 20.0%
0.6 M Sucrose 1.6 1.3 -18.75%
0.8 M Sucrose 1.4 1.1 -21.4%
1.0 M Sucrose 1.6 1.3 -18.75%


Table 5: Potato Core Results: Class Data


Contents


Group 1


Group 2


Total


Class Average


Distilled Water

16.7% 28.5% 45.2% 22.6%
 

0.2 M Sucrose

13.3% 21.4% 34.7% 17.35%
 

0.4 M Sucrose

20.0% 14.28% 34.28% 17.14%
 

0.6 M Sucrose

-18.75% -20.0% -38.75% -19.38%
 

0.8 M Sucrose

-21.4% -26.66% -48.06% -24.03%
 

1.0 M Sucrose

-18.75% -21.42% -40.17% -20.09%
 

Team Members

Stephanie, Tripp, & Eli Hudgens

Kris

NA NA


Graph 2: Percent Change in Mass of Potato Cores at Different Molarities of Sucrose


Exercise 1D

Graph 3: Percent Change in Mass of Zucchini Cores at Different Molarities of Sucrose


If a potato is allowed to dehydrate by sitting in the open air, would the water potential of the potato cells decrease or increase? Why? The water potential of the potato would decrease because water moves from a high water potential region to a low potential region, and a dehydrated potato cell is hypertonic in comparison with the environment. The concentration of solute would increase and osmotic potential would decrease.


If a plant cell has a lower water potential than its surrounding environment, and if pressure is equal to zero, is the cell hypertonic or hypotonic to its environment? Will the cell gain water or lose water? Explain your response. If the plant cell has lower water potential, that means the water will come into the cell; the cell is hypertonic to its environment. This cell will gain water because water follows its concentration gradient.


In figure 1.5, the beaker is open to the atmosphere. What is the pressure potential of the system? The pressure potential is zero.


In figure 1.5, where is the greatest water potential? The greatest water potential is within the dialysis bag.


Water will diffuse_________the bag. Why? Water will diffuse out of the bag because the inside of the bag has the highest water potential.


Calculate solute potential of the sucrose solution in which the mass of the zucchini cores does not change. Show work. ψ s = -iCRT ψ s = (-1)(0.36 mole/liter)(0.0831 liter bar/mole K)(300 K) ψ s = -8.975 bars


Calculate the water potential of the solutes within the zucchini cores. Show work. ψ = ψ s+ ψ p ψ =0 + -8,975 , ψ = -8.975 bars


What effect does adding solute have on the solute potential component of that solution? Why? Adding solute to a solution would increase the solute potential and decrease the water potential.


Consider what would happen to a red blood cell placed in distilled water:
a. Which would have the higher concentration of water molecules? The


distilled water would have the higher concentration of water molecules.


Which would have the higher water potential? The distilled water would also have the higher water potential.


What would happen to the red blood cell? Why? The red blood cell would take in a lot of water and might lyse due to pressure inside. This is because animal cells lack tolerance under hypotonic situations.


Exercise 1E


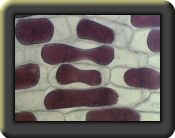
Describe the appearance of the onion cells. The onion cells appear to have great turgor pressure, spread out, thick and bright in the inside. The cell walls were very defined and it was clear where one cell ended and another began.


Describe the appearance of the onion cells after the NaCl was added. The plasma membrane shriveled from the cell wall, or in other words, plasmolysis occurred.


Remove the cover slip and flood the onion with fresh water. Observe and describe what happened. The onion cells were again hypertonic to their environment and were restored to their original state of appearance.


What is plasmolysis? Plasmolysis is the separation of the plasma membrane from the cell wall in a plant cell.


Why did the onion cell plasmolyze? The environment around the cell was hypertonic to the cell so water left the cell to reach dynamic equilibrium with the NaCl solution. With all the water leaving the cell, the cell membrane separated from its cell wall.


In the winter, grass often dies near roads that have been salted to remove ice. What causes this to happen? The salt causes the grass’s environment to become hypertonic, and the water leaves the plant cells, causes withering and eventually death of the plant. The high concentration of salt in the soil also speeds the death of the plant.


Sketch of Onion Cells Onion Cells + NaCl


Error Analysis:


Several could have possibly been made throughout the lab.

Exercise 1A

The data collected in this lab experiment did not appear to contain any errors, however, an error in the results may have unknowingly occurred. If there was a leak where the tubing was twisted shut or a tear in the dialysis tubing, all of the data would be inaccurate.

Exercise 1B

This section of the lab had to be repeated because of incorrect data (that is to say it did not “harmonize” with the other groups’ data). If the person handling the dialysis tubing did not wash their hands thoroughly and accidentally touched the portion of the tubing to serve as the permeable membrane, the oils from their hands could have blocked pores on the tubing, effecting the data.

Exercise 1C
Some mistakes that could have taken place are mathematical miscalculations while finding the initial and final masses. A piece of potato skin could have been left in the beakers along with the potato. This causes problems in the data tables. Another possible source of error could be that the students did not pat dry the potato sample well enough and increased the masses of the cores. Numerous may have occurred while using the electronic balance.

Exercise 1D

In this part of the lab, only calculations were made. Simple mathematical errors are bound to occur in this section of the lab.

Exercise 1E

In part 1E, after adding the NaCl solution to the onion cells, the cells should have reduced in size, but no reaction appeared to take place. This may have occurred in part because the onion itself was already dried out and dehydrated, or while the onion was being looked at through the microscope, the heat from it may have caused the cells to loose water. Another possibility is that the reaction took place so quickly that those witnessing could not see it.

Discussion and Conclusion:


Exercise 1A

The data shows what molecules can and cannot diffuse across a selectively permeable membrane. The color change showed that the Iodine Potassium Iodide was small enough to pass through the pores of the membrane. It is shown that the water and glucose solution moved out of the dialysis bag because water is small enough to pass through the membrane and the Testape tested positive for glucose inside the beaker. The glucose started out inside the bag and tested negative with the Testape inside the beaker before the immersion.

Exercise 1B

It can be concluded from the results gathered during the experiment that sucrose cannot pass through the selectively permeable membrane, but instead water molecules must move across the membrane to the area of lower water potential to reach dynamic equilibrium.


Exercise 1C

The results provided information that leads us to conclude that potatoes do contain sucrose molecules. This is known because the cores took in water while they were emerged in the distilled water. This means they had a lower water potential and higher solute potential than the distilled water.

Exercise 1D

The calculations made it evident that all of the results could be determined and proven correct with the simple equations and formulas. Performing these mathematical computations helped give a better understanding of water and solute potential.

Exercise 1E

This particular part of the lab illustrated the shrinking of the plasma membrane from the cell wall in a plant cell, or, in other words, plasmolysis. It shows how plant cells react in a hypertonic environment, the NaCl solution. The turgor pressure decreases as water leaves the cell. This shows how the onion cells had high water potential so water moved to the area outside the cell with lower water potential. Then, after adding water back to the cells, water moved back into the cells, restoring turgor pressure.

Overall

Water potential and concentration gradients are the two phenomenons that effected the results of the experiments. There are many important facts pertaining to water potential. Water potential is used by botanists to determine the movement in and out of a cell. It is effected by two components, pressure and solute potential. Water moves from areas of higher water potential (higher free energy and more water molecules) to areas of lower water potential (lower free energy and less water molecules). Water diffuses down a water potential gradient. Pure water has an atmospheric pressure of zero which is important when using the formula ψs = -iCRT. Water potential is inversely proportional to solute potential. These facts led to or effected the results gained in each section of the lab.

In plant and animal cells, loss or gain of water can have different effects. In an animal cell, it is ideal to have an isotonic solution. If the solution is hypertonic, the cell will shrivel from lack of water intake. Inversely, if the solution is hypotonic the cell could take in too much water and the cell will lyse and break open. For a plant cell, the ideal solution is a hypotonic solution because the cell takes in water increasing turgor pressure. Turgor pressure is important for plant support and maintaining shape. If the solution is hypertonic, the cell will plasmolyze and died from lack of water. In an isotonic solution, the plant cell does not have enough turgor pressure to prevent wilting and possible death. The information gained through this lab is important in understanding the effects of different solutions on organisms in our environments, including ourselves.

BACK