Graph Examples

Examples of Graphs

LINE GRAPHS
Line Graph title

A line graph is most useful in displaying data or information that changes continuously over time. The example below shows the changes in the temperature over a week in January. Notice that the title of the graph is “Average Daily Temperature for January 1-7 in degrees Fahrenheit”.

To the left is a table that shows the date in one column and the corresponding temperature in the second column. The line graph on the right shows the degrees of temperature going up the vertical axis (up and down numbers on the left of the graph) and the days of the week on the horizontal axis (going sideways from left to right). The points for the temperature for each day are connected by a line – thus the graph is a line graph.

Average Daily Temperature for January 1-7 in Degrees Fahrenheit

Date
Temperature
1 10
2 25
3 30
4 42
5 23
6 25
7 40
Line Graoh of Average Temperatures


Bar Graph Animated title

BAR GRAPHS

Bar graphs are an excellent way to show results that are one time, that aren’t continuous – especially samplings such as surveys, inventories, etc. Below is a typical survey asking students about their favorite after school activity. Notice that in this graph each column is labeled – it is also possible to label the category to the left of the bar. In this case, the numbers for each category are across the bottom of the chart.

A bar chart is marked off with a series of lines called grid lines. These lines typically mark off a numerical point in the series of numbers on the axis or line. In this case, each grid line going up and down marks a multiple of 20 as the graph is divided.  More gridlines can make it easier to be exact with the amounts being shown on the bar graph, but too many can make it confusing.  Notice that for data that does not fall evenly on a multiple of 20, the bar is in between two grid lines.  Bar graphs are useful to get an overall idea of trends in responses – which categories get many versus few responses.

Favorite Student After School Activity

Activity Number
Visit W/Friends 175
Talk on Phone 168
Play Sports 120
Earn Money 120
Use Computers 65
Bar Graph

Circle Pie Graph Title

CIRCLE/PIE GRAPHS

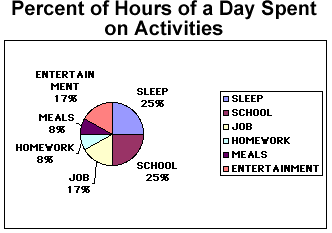
Circle or pie graphs are particularly good illustrations when considering how many parts of a whole are inception. In the table below both the number of hours in a whole day devoted to certain activities is listed as well as the percent of time for each of these activities. The pie chart is then divided very much as a baker’s pie would be into slices that represent the proportional amounts of time spent on each activity.

To the right of the pie chart is a legend that tells which color stands for which category. In addition, the percents are also near the pie slice that stands for that particular amount of time spent.

Percent of Hours of a Day Spent on Activities

ACTIVITY HOURS PERCENT OF DAY
Sleep 6 25
School 6 25
Job 4 17
Entertainment 4 17
Meals 2 8
Homework 2 8


Pie Graph of Day's Activities


Introduction to Life Study Guide bI

Introduction to Life Study Guide

Study of life is known as?
How are genes used by organisms?
Which characteristic of living things relates to stability?
What does homeostasis mean?
What is ecology?
How do heterotrophs obtain energy?
List distinct properties of living things.
What is the smallest unit that can carry on life called?
What are  all living things made of?
Which of the following are characteristics of ALL living things — growth, development, cellular organization, & movement?
A scientist noticed that bacteria weren’t growing in some test tubes. Is this observation, hypothesis, or experimentation?
The scientist suggests that bacteria aren’t growing in some test tubes because they aren’t getting the nutrients they need. Is this observation, hypothesis, experimentation, or conclusion?
A scientist adds a different nutrient to half of the test tubes in which he is growing bacteria. Is this observation, hypothesis, or experimentation?
Define hypothesis.
What is a theory?
A hypothesis is rejected if it does not explain what?
When scientists are planning experiments,  do they have a good idea of the possible results?
If new evidence emerges, do theories change?
Are theories supported with some scientific knowledge?
Are theories proved scientific ideas?
For scientists to communication with each other about their data, what do they do with their data?
How do scientists organize data?
If a microscope has a 30X objective lens & a 10X ocular (eyepiece) lens, what is its magnification?
What are the base units for each of these SI measurements — length? second? volume? mass? 
BACK


Introduction Quiz

Name: 

Introduction Quiz  


True/False
Indicate whether the sentence or statement is true or false.
      introduction_quiz_files/i0020000.jpg      introduction_quiz_files/i0020001.jpg
1.
Refer to the illustration above. Reproduction ensures the ongoing success of both species.
2.
Refer to the illustration above. The sand dollar and paramecium both show organization.
3.
Scientists have not discovered any new species on Earth in more than 20 years.
4.
Publication of the results of scientific investigations enables other scientists to verify these results.
5.
Resolution is a microscope’s power to increase an object’s apparent size.
 

Multiple Choice
Identify the letter of the choice that best completes the statement or answers the question.
6.
Biology is the study of
a.
minerals.
c.
the weather.
b.
life.
d.
energy.
7.
Homeostasis means
a.
a change over long periods of time.
c.
rapid change.
b.
keeping things the same.
d.
the same thing as evolution.
8.
Which of the following is a means by which heterotrophs can obtain energy?
a.
using water, carbon dioxide, and energy from the sun to produce sugars
b.
using water and carbon dioxide to produce energy-rich compounds
c.
consuming autotrophs
d.
consuming simple chemicals from the environment and using them to assemble complex chemicals and structures needed by the organism
9.
Which of the following is not necessarily a distinct property of living things?
a.
homeostasis
c.
complexity
b.
metabolism
d.
reproduction
10.
All organisms are composed of
a.
diatoms.
c.
cells.
b.
cellulose.
d.
None of the above
11.
Which example of scientific methodology is incorrect?
a.
Observation—A number of people in Zaire dying of a disease outbreak
b.
Measurement—A record of the number of people with symptoms of the disease and the number of people who had died from the disease
c.
Analysis of data—Comparison of the effects of mixing monkey cells with virus-containing blood in test tubes and the effects of mixing of liquid from these test tubes with fresh monkey cells
d.
Inference making—Identification of the Ebola virus as the cause of the disease by taking electron micrographs of substances found in the blood of persons affected with the disease
12.
Scientific hypotheses are most often tested by the process of
a.
communicating.
c.
experimenting.
b.
inferring.
d.
analyzing data.
13.
A hypothesis is
a.
a definite answer to a given problem.
b.
a testable possible explanation of an observation.
c.
a proven statement.
d.
a concluding statement.
14.
A hypothesis that does not explain an observation
a.
is known as an inaccurate forecast.
c.
is rejected.
b.
often predicts a different observation.
d.
None of the above
15.
A scientific theory
a.
is absolutely certain.
b.
is unchangeable.
c.
may be revised as new evidence is presented.
d.
is a controlled experiment.
16.
observation : hypothesis ::
a.
theory : observation
c.
certainty : investigation
b.
guess : hypothesis
d.
theory : control
17.
Which of the following components of a scientific investigation would benefit from communication between scientists?
a.
observing
c.
analyzing data
b.
measuring
d.
All of the above
18.
Most typically, the order in which the steps of the scientific method are applied is
a.
observations, predictions, hypothesis, controlled testing, theory, verification.
b.
predictions, observations, hypothesis, theory, controlled testing, verification.
c.
observations, hypothesis, predictions, controlled testing, theory, verification.
d.
observations, hypothesis, predictions, controlled testing, verification, theory.
19.
A light microscope that has an objective lens of 10´ and an ocular lens of 20´ has a magnification of
a.
30´.
c.
300´.
b.
200´.
d.
2000´.
20.
Which of the following associations between an SI base unit abbreviation and its base quantity is incorrect?
a.
A—area
c.
s—second
b.
m—length
d.
mol—amount of a substance


Check Your Work     Reset

Identifying Controls and Variables: Biology Practice with Explanations

Biology Foundations and Lab Skills Teaching Resources · High school biology; AP extensions where noted.

Use these original practice situations to distinguish a treatment, a response, controlled conditions, and a comparison group. They are paper exercises, not instructions to carry out experiments.

Learning goals and materials

Students will identify variables by their role in a stated design and recognize when a comparison cannot support a causal claim. Prerequisite: scientific inquiry notes. Materials: paper and the situations below.

Terms to use

  • Independent variable: the factor deliberately varied in the described experiment.
  • Dependent variable: the measured response.
  • Controlled conditions: relevant factors kept comparable across treatments.
  • Control or comparison group: the condition against which another is interpreted. It is not the same as a controlled variable and need not always mean “nothing happens.”

Situation 1: water and germination

A teacher randomly assigns 12 identical containers, each with ten seeds from one seed lot, to three water volumes: 5, 10, or 15 mL initially. There are four containers per volume. All are observed for seven days under the same planned light and temperature conditions. The measured response is the proportion of seeds germinated in each container.

  1. Identify the independent and dependent variables.
  2. Name two conditions to keep comparable.
  3. If 10 mL is the usual classroom condition, what can it provide?
  4. What is the independently treated experimental unit?

Situation 2: two changes at once

One set of seedlings receives a new nutrient solution beside a sunny window. Another receives plain water in a dim cupboard. The sunny set becomes taller.

Can this comparison establish that the nutrient solution caused the difference? Propose one change to improve the design.

Situation 3: observational data

A class measures leaf length and width on leaves already collected by a teacher. Nothing is assigned or changed. Longer leaves tend to be wider.

Identify the two measured variables. Does the class have a manipulated independent variable or an experimental control group? Can the association establish causation?

Answer explanations

  • Situation 1: water volume is varied; germination proportion per container is measured. Seed source, container type, observation period, and planned environmental conditions should be comparable. The usual 10 mL condition supplies a reference. Each container is the independently treated unit; the seeds within it share conditions. Four containers are not forty independent treatment replicates.
  • Situation 2: light and nutrient conditions differ together. Either could contribute, so the design confounds them. Keep light comparable while assigning nutrient treatments across multiple independent containers, or use a design that examines both factors separately.
  • Situation 3: length and width are measured, with no manipulated treatment and no experimental control group. One may be placed on the horizontal axis for analysis, but that does not make it an experimentally manipulated cause. The pattern alone does not establish causation.

Teaching note: Ask for the measurement definition, not just the noun “growth.” For AP extension, distinguish repeated measurements, subsamples, and independent treatment replicates. The older cartoon-based exercise is replaced here; its scenarios and answers are not reused.

Related teaching resources

Sources and further reading

Graph Examples

Examples of Graphs

LINE GRAPHS

Line Graph title

A line graph is most useful in displaying data or information that changes continuously over time. The example below shows the changes in the temperature over a week in January. Notice that the title of the graph is “Average Daily Temperature for January 1-7 in degrees Fahrenheit”.

To the left is a table that shows the date in one column and the corresponding temperature in the second column. The line graph on the right shows the degrees of temperature going up the vertical axis (up and down numbers on the left of the graph) and the days of the week on the horizontal axis (going sideways from left to right). The points for the temperature for each day are connected by a line – thus the graph is a line graph.

Average Daily Temperature for January 1-7 in Degrees Fahrenheit

Date
Temperature
1 10
2 25
3 30
4 42
5 23
6 25
7 40
Line Graoh of Average Temperatures


Bar Graph Animated title

BAR GRAPHS

Bar graphs are an excellent way to show results that are one time, that aren’t continuous – especially samplings such as surveys, inventories, etc. Below is a typical survey asking students about their favorite after school activity. Notice that in this graph each column is labeled – it is also possible to label the category to the left of the bar. In this case, the numbers for each category are across the bottom of the chart.

A bar chart is marked off with a series of lines called grid lines. These lines typically mark off a numerical point in the series of numbers on the axis or line. In this case, each grid line going up and down marks a multiple of 20 as the graph is divided.  More gridlines can make it easier to be exact with the amounts being shown on the bar graph, but too many can make it confusing.  Notice that for data that does not fall evenly on a multiple of 20, the bar is in between two grid lines.  Bar graphs are useful to get an overall idea of trends in responses – which categories get many versus few responses.

Favorite Student After School Activity

Activity Number
Visit W/Friends 175
Talk on Phone 168
Play Sports 120
Earn Money 120
Use Computers 65
Bar Graph

Circle Pie Graph Title

CIRCLE/PIE GRAPHS

Circle or pie graphs are particularly good illustrations when considering how many parts of a whole are inception. In the table below both the number of hours in a whole day devoted to certain activities is listed as well as the percent of time for each of these activities. The pie chart is then divided very much as a baker’s pie would be into slices that represent the proportional amounts of time spent on each activity.

To the right of the pie chart is a legend that tells which color stands for which category. In addition, the percents are also near the pie slice that stands for that particular amount of time spent.

Percent of Hours of a Day Spent on Activities

ACTIVITY HOURS PERCENT OF DAY
Sleep 6 25
School 6 25
Job 4 17
Entertainment 4 17
Meals 2 8
Homework 2 8


Pie Graph of Day's Activities