Biology Graphing Practice: Choose, Build, and Explain a Graph

Biology Foundations and Lab Skills Teaching Resources · High school biology; AP extensions where noted.

A useful graph makes the measured variables, units, and comparison clear. Choose the graph from the question and type of data, rather than making every biology dataset a line graph.

Learning goals and materials

Students will select an appropriate graph, label axes, plot values accurately, and write an evidence-based interpretation. Prerequisites: variables, units, and numerical scales. Materials: graph paper and pencil, or accessible spreadsheet software. The data below are simulated for teaching.

Choose a graph

  • Line graph: useful for changes through ordered time points; connected segments suggest change between successive measurements.
  • Bar chart: compare distinct categories. Keep gaps between categories and normally start the value axis at zero so bar lengths are meaningful.
  • Scatterplot: examine paired numerical measurements, such as leaf length and width. Usually do not connect each point to the next; the order of independent cases is arbitrary.

In a simple experiment, the deliberately varied factor commonly goes on the horizontal axis. In an observational study, a horizontal-axis variable is not necessarily a manipulated cause. A key identifies multiple series; a caption explains the data and context. They serve different purposes.

Practice 1: change over time

Time (days)Seedling height (cm)
00
24
47
69
810

Plot time against height, label units, and state which two-day interval shows the greatest increase. Treat this as a constructed record of one seedling, not evidence from replicated treatment groups.

Practice 2: compare categories

ConditionGerminated seedsSeeds observed
A820
B1420
C1120

Make a bar chart of germination percentage for each condition. Explain what the categories do and do not tell you: these labels give no details about treatment, replication, or assignment, so do not infer a specific biological cause.

Practice 3: paired measurements

Leaf length (cm)Leaf width (cm)
31.5
42.0
52.1
63.0
73.2
84.0

Create a scatterplot and describe the relationship. Do not claim that changing length causes width to change.

Feedback and checks

  • Practice 1: the largest increase is 4 cm from day 0 to day 2; the mean increase over that interval is 2 cm per day.
  • Practice 2: A = 40%, B = 70%, and C = 55%. B exceeds A by 30 percentage points. That is not the same as a 30% relative increase.
  • Practice 3: a positive association appears, with some variation in the increments. The points alone do not establish causation.

Check titles, axis labels, units, evenly spaced scale intervals, plotting, and claims supported by data. A nonzero origin on a scatterplot can be useful if clearly labeled; a rule that every graph must begin at zero is too broad. For AP extension, compare raw observations with summaries and explain any uncertainty bars used.

Legacy worksheet note

The previous Word download includes a medical diagnosis exercise with problematic units and claims. The revised practice above replaces that activity. Use these original nonmedical data for graphing; they are not an answer key to the legacy file.

Related teaching resources

Sources and further reading

Graph Examples

Examples of Graphs

LINE GRAPHS

Line Graph title

A line graph is most useful in displaying data or information that changes continuously over time. The example below shows the changes in the temperature over a week in January. Notice that the title of the graph is “Average Daily Temperature for January 1-7 in degrees Fahrenheit”.

To the left is a table that shows the date in one column and the corresponding temperature in the second column. The line graph on the right shows the degrees of temperature going up the vertical axis (up and down numbers on the left of the graph) and the days of the week on the horizontal axis (going sideways from left to right). The points for the temperature for each day are connected by a line – thus the graph is a line graph.

Average Daily Temperature for January 1-7 in Degrees Fahrenheit

Date
Temperature
1 10
2 25
3 30
4 42
5 23
6 25
7 40
Line Graoh of Average Temperatures


Bar Graph Animated title

BAR GRAPHS

Bar graphs are an excellent way to show results that are one time, that aren’t continuous – especially samplings such as surveys, inventories, etc. Below is a typical survey asking students about their favorite after school activity. Notice that in this graph each column is labeled – it is also possible to label the category to the left of the bar. In this case, the numbers for each category are across the bottom of the chart.

A bar chart is marked off with a series of lines called grid lines. These lines typically mark off a numerical point in the series of numbers on the axis or line. In this case, each grid line going up and down marks a multiple of 20 as the graph is divided.  More gridlines can make it easier to be exact with the amounts being shown on the bar graph, but too many can make it confusing.  Notice that for data that does not fall evenly on a multiple of 20, the bar is in between two grid lines.  Bar graphs are useful to get an overall idea of trends in responses – which categories get many versus few responses.

Favorite Student After School Activity

Activity Number
Visit W/Friends 175
Talk on Phone 168
Play Sports 120
Earn Money 120
Use Computers 65
Bar Graph

Circle Pie Graph Title

CIRCLE/PIE GRAPHS

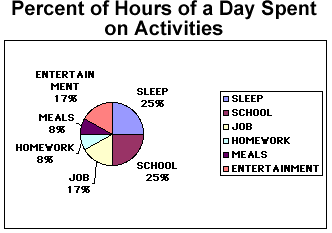
Circle or pie graphs are particularly good illustrations when considering how many parts of a whole are inception. In the table below both the number of hours in a whole day devoted to certain activities is listed as well as the percent of time for each of these activities. The pie chart is then divided very much as a baker’s pie would be into slices that represent the proportional amounts of time spent on each activity.

To the right of the pie chart is a legend that tells which color stands for which category. In addition, the percents are also near the pie slice that stands for that particular amount of time spent.

Percent of Hours of a Day Spent on Activities

ACTIVITY HOURS PERCENT OF DAY
Sleep 6 25
School 6 25
Job 4 17
Entertainment 4 17
Meals 2 8
Homework 2 8


Pie Graph of Day's Activities


Chapter 1 Worksheet BI


Biology – Science of Life


Section 1-1            Themes of Biology 

1. How many species of organisms are estimated to inhabit the Earth? 

2. About how many species have actually been identified? 

3. When did the first life forms probably arise on Earth? 

4. What was the first organism like? 

5.  What is an organism? 

6. Most unicellular organisms can only be seen with a __________________________.

7. Where did these first cells live? 

8. Over time, organisms _____________ and new kinds of _______________ arose from ___________ of organisms and came to inhabit every _______________ of the Earth. 

9. Define biology. 

10. Name several things that the study of biology would include. 

11. The study of biology is unified by ___________________________. 

12. Name 6 unifying themes of biology. 

13. What is a cell? Where are they found? 

14. What is the difference between a unicellular & a multicellular organism? 

15. Cells are ___________________ but highly _______________________.

16. Are all cells alike? Explain. 

17. All cells are surrounded by a ____________ & contain _____________  instructions. 

18. Genetic instructions are used by cells to make new __________ and new cell ________________. 

19. How do new cells produced by unicellular organisms compare to the parent unicellular organism? 

20. How do mature multicellular organisms begin their life? 

21. If multicellular organisms begin their life as one cell, how do they have so many cells? Explain. 

22. Give an example of an organism maintaining a stable internal environment. 

23. Define homeostasis and tell whether it occurs in unicellular&/or multicellular organisms. 

24. Genetic information is passed to offspring during _______________________.

25. What molecule contains the cell’s hereditary information?

26.  How does DNA exist in multicellular organisms? In unicellular organisms? 

27. What is a gene?

28. In multicellular organisms, each body cell has an _____________ copy of its DNA.

29. Does each cell in a multicellular organism use all the genes on its DNA? Explain. 

30. Explain sexual reproduction. 

31. When a sperm joins with an egg to make a fertilized cell, what happens next to this cell? 

32. New organisms from sexual reproduction have _______________ material from both parents.

33. Explain asexual reproduction. 

34. Name a unicellular organism that reproduces by asexual reproduction.

35. New cells or organisms from asexual reproduction have ____________ genetic information. 

36. What is evolution? 

37. Do individuals or populations evolve? 

38. What is the driving force for evolution? 

39. Explain natural selection and give an example. 

40. Competition for what types of resources drives natural selection? 

41. Why is it so important to a species for members to survive? 

42. Organisms that survive and reproduce are ones with ________________ traits.

43. Define ecology. 

44. What are ecosystems and give an example? 

45. Name 3 things organisms must get from the environment to survive. 

46. What has been the effect of man’s activities on many ecosystems? 

47. Living things are _______________ and need a constant supply of _________________.

48. What process supplies energy for organisms on Earth? 

49. Define autotroph. 

50. Autotrophs trap _________ and use this energy to combine __________ and  _________ into__________ and starches. 

51. Define heterotrophs. 

52. Give an example of an autotroph.

53. Give several examples of heterotrophs. 

54. How do heterotrophs get their food? 

Section 1-2            World of Biology 

55. List 6 characteristics shared by all living things. 

56. All living things composed of  _________________.

57. Cells may be specialized in _________________ organisms. What does this mean?

58. What is always true about cell size?

59. Living things are organized at what 2 levels?

60. How are cells organized in multicellular organisms?

61. Define metabolism. 

62. The energy from metabolism is used for ___________, ___________, and _______________ of organisms. 

63. What is homeostasis and give an example? 

64. Is growth a characteristic of living and nonliving things? Explain.

65. What 2 things must occur for living things to grow?


66. Define cell division.


67. Define development.


68. Explain why development is necessary for multicellular organisms?


69. Is reproduction essential to the survival of a species? Explain.


70. Sexual reproduction produces offspring ______________________ to the parents.


71. Have all organisms been identified? Explain.


Section 1-3            Scientific Method


72. Scientists solve problems using the ___________________________.


73. The first step of the scientific method is when scientists make ___________________ of the natural world.

74. Define data.


75. What does a scientist usually employ in making their observations?


76. What is quantitative data?


77. What is sampling & why is it used by scientists?


78. What 2 things must be true for samples to be useful?


79. To be useful, data must be _____________________ into ____________________,


       ______________________, and _____________________, or maps.


80. Once an observation is made, the second thing a scientist must do is to develop a(n) ___________________________.


81. Define hypothesis.


82. All hypotheses must be __________________ to give supporting evidence.


83. What is a prediction & how are they usually written?


84. What is an experiment?


85. Name the 2 groups in a controlled experiment.


86. Both groups in an experiment are identical except for ___________ factor called the


       ___________________.

87. Name the 2 types of variables in a controlled experiment.


88. After data is collected and organized, it must be __________________ to tell if it is reliable.


89. If experimental data does not support the hypothesis, what should be done?


90. What is a scientific model?


91. What is an inference?


92. How is a theory formed?


93. Define theory.


94. What is the difference between a field biologist and a laboratory biologist? Do they both use the scientific method?


95. What do scientists do with the results of their scientific studies?


Section 1-4            Microscopes & Measurement


96. What is a microscope?


97. What is the difference between resolution & magnification?


98. When would a microscope be used?


99. Do all microscopes have the same magnification & resolution?


100.  Draw and label the parts of a light (LM) microscope.


101. Tell the function of each of these parts of an LM — stage, light source, objective lens, ocular lens, & nosepiece.


102. To view specimens with a light microscope, they must be placed on a _______________


         and be ________________ so light will pass through to the lenses & your eyes.


103. What is the power of magnification & explain how it is determined?


104. Light microscopes can only magnify up to ______________ before the image becomes blurry.

105. What type of scope is used to view viruses & cell parts?


106. What produces an image with the electron microscope?


107. Name the 2 main types of electron microscopes.


108. What is the highest magnification for the TEM? For the SEM?


109. Can electron microscopes be used to view living cells?


110. What type of scope gives a magnified view of an object’s surface?


111. What is the standard unit of measurement used by scientists?


112. Name the SI base units, what they measure, & give their abbreviations (table 1-1, page 23)


113. The SI system is based on units of __________ with designated _________________.


114. Give the SI prefix for these base units — 1000, .01, .001, .000001, .000000001, & .000000000001.


115. Give the SI unit for area, volume, and time.


Introduction Notes

Introduction

All Materials © Cmassengale

Study of Life  

  • First life forms arose on Earth more than 3.5 billion years ago  
  • Single-celled, microscopic organisms (living thing) appeared first & floated alone in seas  
  • Over 40 million species (types of organisms) exist with only about 2 million identified 
  • Many organisms are unidentified & new species are still discovered  
  • Biology is the study of all living things and how they interact with each other & their environment  
  • Over long periods of time, species changed or evolved so that new species arose from earlier organisms & came to inhabit almost every part of the earth (bacteria living in thermal vents, parasites living inside another organism, etc.)  
  • Organisms must adapt to their specific environment to survive & reproduce


Unifying Themes of Biology 

 The six unifying themes include:  

  1. Cell Structure & Function
  2. Stability & Homeostasis
  3. Reproduction & Inheritance
  4. Evolution
  5. Interdependence of Organisms
  6. Matter, Energy, & Organization

Cell Structure & Function  

  • Cell is the basic unit of structure & function  
  • All organisms are made of one or more cells; Unicellular (one celled) or Multicellular (Composed of more than one cell)  


UNICELLULAR AMOEBA

  • Cells are small but highly organized; they contain specialized structures that carry out the jobs of a cell called organelles  


CELLULAR ORGANELLES

  • There are many different kinds of cells, but all cells have similarities
  • All cells are surrounded by a cell membrane, contain cytoplasm, and have DNA (the genetic information for making new cells or cell structures)  
  • New cells made by unicellular organisms are identical (clones) to the parent cell that produced them – asexual reproduction  
  • Multicellular organisms begin life as one fertilized cell (sexual reproduction), but the cells multiplied and underwent differentiation (changed structure & function) to become many different kinds of cells  

Stability & Homeostasis  

  • All organisms maintain stable internal conditions such as body temperature & water content
  • Stable level of internal conditions called homeostasis  

Reproduction & Inheritance  

  • All organisms reproduce new organisms like themselves by transmitting hereditary material to their offspring  
  • DNA (Deoxyribonucleic acid) is a large molecule containing the hereditary material of the cell


DNA MODEL

  • In unicellular organisms like bacteria, DNA exists as a single loop or chromosome in the cytoplasm  


BACTERIA

  • In multicellular organisms, DNA is enclosed in a membrane known as the nucleus 
  • Genes are short segments of DNA the carry the instructions for a single trait of an organism  
  • DNA of a cell contains all of the genes (instructions) it will ever need  
  •  All body cells have a complete set of DNA (genome), but different types of cells use certain genes from the set; example: Muscle cells have the genes to make thyroxine, but they don’t use these genes  
  • In sexual reproduction, an egg (ovum) is fertilized by a sperm to form a zygote so the new organism is made of cells with hereditary information from both parents  
  • In asexual reproduction, cells copy their DNA & split so all new cells are identical  

Evolution  

  • Populations of organisms change over time or evolve (Theory of Evolution)  


DARWIN – THEORY OF EVOLUTION

  • Natural selection or “survival of the fittest” is the process that drives evolution  
  • Organisms with favorable traits are better able to survive & reproduce  
  • The survival of organisms with favorable traits causes a gradual change in populations of organisms over many generations  
  • Evolution by natural selection is driven by competition for resources such as food, habitat, mates  

Interdependence of Organisms  

  • Ecology is the study of the interaction of organisms with each other and their environment  
  • Sunlight is the ultimate energy for all organisms  
  • Energy from the sun is passed from one organism to another; producers (plants) to herbivore (plant eater) to carnivore (meat eater) to decomposers (break down dead organisms)  


ENERGY FLOW IN A FOOD CHAIN

  • Abiotic (nonliving factors) such as air, water, energy, soil, temperature, & minerals are also needed for survival  
  • Biotic factors include all living things on earth (plants, animals, fungi, microorganisms)  
  • Biosphere supports life & includes the biotic (all organisms) & the abiotic (all nonliving factors) on earth  
  • Organisms respond to their environment by:
    * Fleeing
    * Adapting
    * Dying
  • Most organisms can survive a temporary change, but permanent change can lead to extinction (dinosaurs)  
  • Thousands of species are listed endangered (population so small could become extinct)  
  • Human interference is the main cause for endangerment & extinction
    * Pollution of land, air, and water
    *Hunting for sport, food, and commercial products also threatens the survival of many organisms
    * Clear-cutting rain forests
    * Diverting rivers & lakes
    * Draining wetlands (everglades)
    *Global Warming  
  •   Endangered organisms can be protected & returned to larger population size (American Bison almost wiped out –60 million to 250 in 90 years- now several thousand herds)  


AMERICAN BISON

  • Species is a group of organisms so similar to one another that they can interbreed & produce fertile offspring  
  •  Extinction of any species upsets the balance of nature (Almost extinct Pacific Yew tree found to contain chemical used to treat cancer)  


PACIFIC YEW TREE

Matter, Energy, & Organization  

  • Organisms are highly organized, maintain internal order, & require a constant energy supply
  • Plants & unicellular organisms with chlorophyll capture sunlight through photosynthesis & store it in food to be used by other organisms  
  • Autotrophs or producers use sunlight, water, & carbon dioxide to make glucose (energy rich sugar) & oxygen – photosynthesis  

  • Heterotrophs (consumers) feed on producers or other consumers to get energy & release carbon dioxide  

   Biology affects life in many ways  

  • Biotechnology uses organisms to make products needed by people (human insulin made by bacteria)
  •   Fossils fuels (coal, oil, & natural gas) provide energy & materials such as nylon & polyester  


OIL DRILLING

  • Animal products such as wool, silk, and leather make clothing  
  •  Wood provides energy & shelter for us, but endangers other animals (spotted owl) when forests are cut  
  • New medicines, better water treatment & garbage disposal improves our health
BACK

Chapter 1 AP Objectives


CHAPTER 1          INTRODUCTION: THEMES IN THE STUDY OF LIFE
OBJECTIVES
Exploring Life on Its Many Levels

1.  Briefly describe the unifying themes that characterize the biological sciences.

2.  Diagram the hierarchy of structural levels in biological organization.

3.  Explain how the properties of life emerge from complex organization.

4.  Describe the two major dynamic processes of any ecosystem.

5.  Distinguish between prokaryotic and eukaryotic cells.

6.  Describe the basic structure and function of DNA.

7.  Describe the dilemma of reductionism.

8.  Discuss the goals and activities of systems biology. List three research developments that have advanced systems biology.

9.  Explain the importance of regulatory mechanisms in living things. Distinguish between positive and negative feedback.

Evolution, Unity, and Diversity

10. Distinguish among the three domains of life. List and distinguish among the three kingdoms of multicellular, eukaryotic life.

11. Explain the phrase “life’s dual nature of unity and diversity.”

12. Describe the observations and inferences that led Charles Darwin to his theory of evolution by natural selection.

13. Explain why diagrams of evolutionary relationships have a treelike form.

The Process of Science

14. Distinguish between discovery science and hypothesis-based science. Explain why both types of exploration contribute to our understanding of nature.

15. Distinguish between quantitative and qualitative data.

16. Distinguish between inductive and deductive reasoning.

17. Explain why hypotheses must be testable and falsifiable but are not provable.

18. Describe what is meant by a controlled experiment.

19. Distinguish between the everyday meaning of the term theory and its meaning to scientists.

20. Explain how science is influenced by social and cultural factors.

21. Distinguish between science and technology. Explain how science and technology are interdependent.


BACK