Graphing Practice

Graphing Practice

Introduction

  • Graphing is an important procedure used by scientists to display the data that is collected during a controlled experiment
  • Line graphs must be constructed correctly to accurately portray the data collected
  • Many times the wrong construction of a graph detracts from the acceptance of an individual’s hypothesis
  • A graph contains five major parts:
    a. Title
    b. The independent variable
    c. The dependent variable
    d. The scales for each variable
    e. A legend
  • The title: depicts what the graph is about. By reading the title, the reader should get an idea about the graph. It should be a concise statement placed above the graph.
  • The Independent Variable: is the variable that can be controlled by the experimenter. It usually includes time (dates, minutes, hours), depth (feet, meters), temperature (Celsius). This variable is placed on the X axis (horizontal axis).
  • The Dependent Variable: is the variable that is directly affected by the independent variable. It is the result of what happens because of the independent variable. Example: How many oxygen bubbles are produced by a plant located five meters below the surface of the water? The oxygen bubbles are dependent on the depth of the water. This variable is placed on the Y-axis or vertical axis.
  • The Scales for each Variable: In constructing a graph one needs to know where to plot the points representing the data. In order to do this a scale must be employed to include all the data points. This must also take up a conservative amount of space. It is not suggested to have a run on scale making the graph too hard to manage. The scales should start with 0 and climb based on intervals such as: multiples of 2, 5, 10, 20, 25, 50, or 100. The scale of numbers will be dictated by your data values.
  • The Legend: is a short descriptive narrative concerning the graph’s data. It should be short and concise and placed under the graph.
  • The Mean for a group of variables: To determine the mean for a group of variables, divide the sum of the variables by the total number of variables to get an average.
  • The median for a group of variables: To determine median or “middle” for an even number of values, put the values in ascending order and take the average of the two middle values.    e.g.    2, 3, 4, 5, 9, 10     Add 4+5 (2 middle values) and divide by 2 to get 4.5
  • The mode for a group of variables: The mode for a group of values is the number that occurs most frequently.     e.g.   2, 5,  8, 2,  6,  11    The number 2 is the mode because it occurred most often (twice)  

Procedure 1:
Using the following data, answer the questions below and then construct a line graph.


Depth in meters Number of Bubbles / minute Plant A Number of Bubbles / minute Plant B
2 29 21
5 36 27
10 45 40
16 32 50
25 20 34
30 10 20


1. What is the dependent variable and why?  

2. What is the independent variable and why?

3. What title would you give the graph? .

4. What are the mean, median, and mode of all 3 columns of data? 

a). Depth :                      Mean____________Median__________Mode________ 

b). Bubble Plant A.:        Mean ____________Median_________Mode________ 

c). Bubbles Plant B:        Mean ____________Median_________Mode________

Graph Title: _________________________________________________________

Legend: ______________________________________________________________ 

Procedure 2:
Diabetes is a disease affecting the insulin producing glands of the pancreas. If there is not enough insulin being produced by these cells, the amount of glucose in the blood will remain high. A blood glucose level above 140 for an extended period of time is not considered normal. This disease, if not brought under control, can lead to severe complications and even death. 

Answer the following questions concerning the data below and then graph it.  


Time After Eating hours Glucose mg /dL of Blood Person A Glucose mg /dL of Blood Person B
0.5 170 180
1 155 195
1.5 140 230
2 135 245
2.5 140 235
3 135 225
4 130 200


 1. What is the dependent variable and why?

2. What is the independent variable and why?

3. What title would you give the graph?

4. Which, if any, of the above individuals (A or B) has diabetes? 

5. What data do you have to support your hypothesis? 

6. If the time period were extended to 6 hours, what would the expected blood glucose level for Person B? 

Title: ________________________________________________________________

Legend: ______________________________________________________________

Summary:
1. What conclusions can be determined from the data in graph 1?

2. What conclusions can be determined from the data in graph 2?

3. Can the data in each of these graphs be used to construct other types of graphs?

4. If so, what other graph types can be constructed?


BACK


Click Here for Notebook Copy

Genetic Traits Activity


Finding Your Genetic Match

Introduction:

Have you ever noticed that brothers or sisters often look alike?  Their inherited traits are what make their physical appearance so similar. An inherited trait is a particular genetically determined characteristic that distinguishes a person. The traits of children are determined by the traits that  are passed on from their parents. Some traits are obvious in a family — a child’s nose is shaped like their mother’s nose, but some traits are less obvious. You may have similar traits to many of your classmates even though you are not related to them. Some examples of often un-noticed human traits are the ability or not to roll your tongue, attached or unattached earlobes, dimples or freckles, naturally curly or straight hair, hitchhiker’s or straight thumb, straight or widow’s peak hairline, smooth or cleft chin, or colorblindness or normal vision.

There are numerous traits in humans, but some traits occur more frequently than others.  Between 70-90% of the human population have free-hanging earlobes, can roll their tongue,  are right-handed, and can taste a chemical called PTC.  These traits are called high frequency traits.

Objective:

Students will determine the presence of certain high frequency traits in themselves & their classmates.

Materials:

Genetic Inventory sheet with pictures, paper, pencil, PTC taste strips.

Procedure:

  1. Identify which of the following 10 human traits you have by placing a check mark beside that trait.
  2. Compare the traits you have with other students in the classroom and find the student you most closely match.


Human Trait Inventory
Student:
Tongue Roller
Non-Tongue Roller
Attached Earlobes
Unattached earlobes
Dimples
No Dimples
Right-handed
Left-Handed
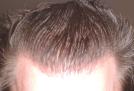
Widow’s Peak
Straight Hairline
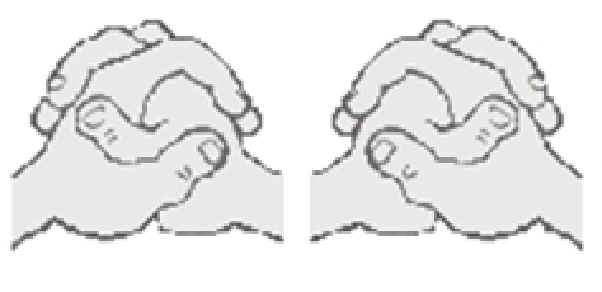
Left Thumb on top when Hands Crossed
Right Thumb on top when Hands Crossed
Hair on mid-digit of hand
No hair on mid-digit of hand
Bent little finger
Straight little finger
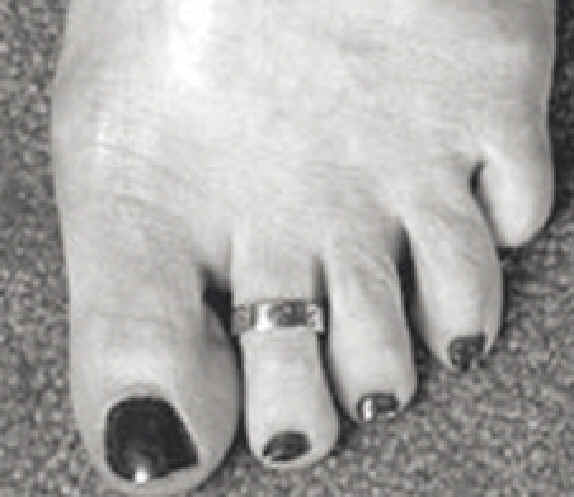
Second toe longer than big toe
Second toe not longer than big toe
Can Taste PTC
Can Not Taste PTC
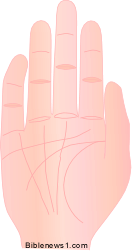
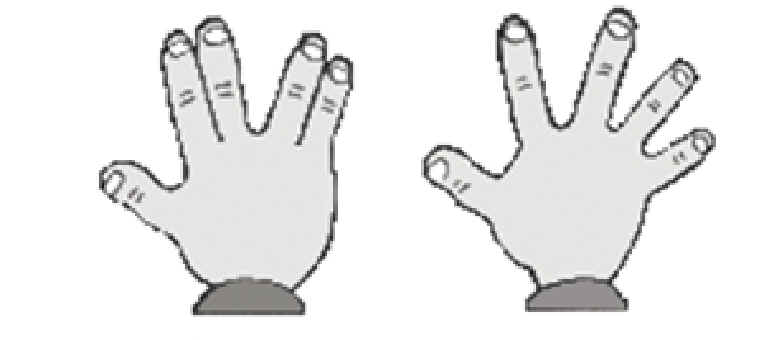
Vulcan (Fingers spread 2 by 2)
None Vulcan
Class Match:


Tongue Roller Non Roller Dimples No Dimples
Attached Earlobes Unattached Earlobes Widow’s Peak Straight Hairline
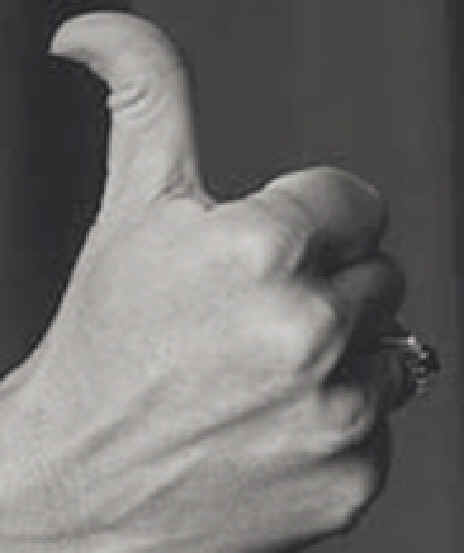
Longer Second Toe Short Second Toe Bent Little finger Hitchhiker’s Thumb
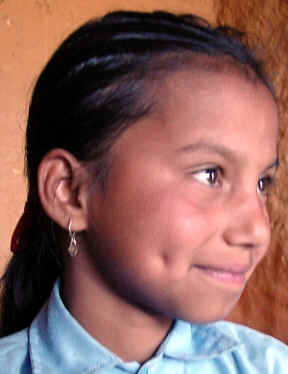
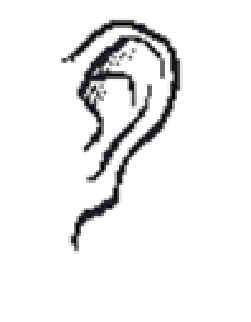
Attached Ear lobes (left)
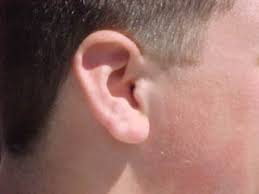
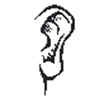
Unattached ear Lobes (right)
“VULCAN” or No “VULCAN” Dimples Right/Left Thumb on top


Genetics PPT Questions


Mendelian Genetics
PowerPoint Questions
Gregor Mendel

1. Who is responsible for our laws of inheritance?

2. What organism did Mendel study?

3. When was Mendel’s work recognized?

4. When did Mendel perform his experiments & how many plants did he grow?

5. What did Mendel notice about offspring traits?

6. How is Mendel referred to today?

7. In what country did Mendel do his research on peas?

8. Mendel stated that physical traits were inherited as _______________.

9. Today we know that particles are actually what?

Terminology

10. Define these three terms:
a. trait –


b. heredity –

c. genetics –


11. Name & describe two types of genetic crosses.


12. What is used to solve genetic crosses?

13. Sketch a Punnett square & show how they are  used to solve a genetics problems.


14. Use a Punnett square to solve a cross between two parents that both have the genotype Yy.


15. What are alleles & what are the two forms?


16. Explain the difference between dominant & recessive alleles.


17. Using a letter of the alphabet, show how each allele would be represented.


18. What is a genotype and write 3 possible genotypes?


19. What is a phenotype and write possible phenotypes for your genotypes in question 18?


20. Using these alleles, R = red flower and r = yellow flowers, write all possible genotypes & phenotypes.


21. What are homozygous genotypes?


22. Write a homozygous dominant genotype.

23. Write a homozygous recessive genotype.

24. What is meant by a heterozygous genotype?


25. Write a heterozygous genotype.

26. Heterozygous  genotypes are also called _____________.

27. What two things actually determine an organism’s characteristics?

Pea Experiments

28. Give 4 reasons that Mendel used garden peas, Pisum sativum, for his experiments.


29. Name the male and female parts of a flowering plant and explain how pollination occurs.


30. What is the difference between self and cross pollination?


31. Explain how Mendel cross pollinated his pea plants.


32. How did Mendel get pure plants?

33. Name 8 pea plant traits and give the dominant & recessive form of each.


34. How did Mendel’s experimental results compare to the theoretical genotypic ratios? Explain.


35. What does P1 mean?

36. What is the F1 generation?

37. What is the F2 generation?

38. What results from this cross — TT  x  tt?

39. What results do you get from crossing two hybrids (Tt   x  Tt)?


40. Show all your work for solving a P1 monohybrid cross for seed shape.
Trait:
Alleles:

P1 cross:  __________ x __________

Genotype ____________
Phenotype ___________
G. Ratio _____________
P. Ratio _____________


41. The offspring of the above cross are called the _____ generation.

42. Show all your work for solving a F1 monohybrid cross for seed shape.
Trait:
Alleles:

F1 cross:  __________ x __________

Genotype ____________
Phenotype ___________
G. Ratio _____________
P. Ratio _____________

43. Show all your work for solving both F2 monohybrid crosses for seed shape.

Trait:
Alleles:

F2 cross:  ________ x ________  F2 cross:  ________ x ________


Genotype ____________                  Genotype ____________
Phenotype ___________                   Phenotype ___________
G. Ratio _____________                   G. Ratio _____________
P. Ratio _____________                    P. Ratio _____________

Mendel’s Laws

Complete the following question:

44. _________ are responsible for inherited traits.

45. Phenotype is based on _______________.

46. Each trait requires _____ genes, one from each ____________.

47. State the Law of Dominance and give an example.


48. State the Law of Segregation and tell when alleles are “recombined”.


49. State the Law of Independent assortment & tell what type of crosses show this.


50. Using the formula 2n where n = the number of heterozygotes, tell how many gametes will be produced by each of the following allele combinations:
a. RrYy
b. AaBbCCDd
c. MmNnOoPPQQRrssTtQq

51. What are the possible allele combinations in the egg and sperm from the following cross — RrYy x RrYy.


52. Show how to work an F1 dihybrid cross for seed shape & seed color.

Traits:
Alleles:


F1 cross   __________ x __________


GR         Genotypes           PR         Phenotypes


53. Complete this cross or crosses for eye color & curliness of the hair — bbC__ x bbcc.


54. Draw a table summarizing Mendel’s 3 laws.


Incomplete and Co-Dominance

55. Incomplete dominance occurs in __________ and produces a phenotype _______________ the phenotype of the two parents.

56. Show your work solving a cross for flower color in snapdragons when there is incomplete dominance.

Trait:
Alleles:

Cross:  RR x rr


Genotype ____________
Phenotype ___________
G. Ratio _____________
P. Ratio _____________

57. What is codominance & give an example?


58. Write the genotypes for each of these blood types:

type A
type B
type AB
type O

59. Solve this codominance problem: IBIB x IAi.


60. Solve this codominance problem for blood type: ii x IAIB.


Sex-Linked Traits

61. What are sex linked traits?


62. Name the sex chromosomes.

63. Write the genotype for male and for female.

64. Most sex-linked traits are carried on what chromosome?

65. Give an example of a sex-linked trait in fruit flies.

66. Show the results of crossing a red-eyed male (XRY)  with a white-eyed female (XrXr) fruit fly.
RR =
Rr =
rr =
XY =
XX =

Cross:    __________ x __________


Genotype ____________
Phenotype ___________
G. Ratio _____________
P. Ratio _____________

67. What is meant by a female carrier?


68. Name a disease that can be carried in this manner.


Evolution & Phylogeny AP Study Guide


Unit 6  Evolution & Phylogeny Study Guide
  • Be able to give an example of an idea that Charles Darwin borrowed from Thomas Malthus
  • Know some anatomical structures that would be homologous to the wing of a bat
  • Know what important information was unavailable to Darwin in the mid-nineteenth century when he formulated his theory of evolution
  • Know the name of Darwin’s 1859 publication
  • Be able to explain all parts of the Darwin-Wallace theory of natural selection
  • Be able to explain how phylogenetic relationships are determined for closely related species
  • Be able to differentiate between analogous & homolgous structures
  • Know the requirements for the maintenance of  Hardy-Weinberg equilibrium
  • Be able to use the Hardy-Weinberg equation to determine allele frequencies and genotypic frequencies
  • Be able to describe and give an example of a cline
  • Be able to explain the bottleneck effect
  • Know what process creates new alleles and serves to balance natural selection
  • Be able to explain & give an example of genetic drift
  • Know what is meant by the “gene pool”
  • Know the major divisions of geologic time
  • Be able to give several examples of fossil types
  • Be able to explain binomial nomenclature
  • Be able to list in order the major taxonomic categories
  • Know what individuals in a population would most often carry copies of harmful recessive alleles
  • Be able to explain & give an example of hybrid sterility
  • Be able to explain & give an example of ecological isolation of species
  • Know what polyploidy is & how it can cause rapid speciation
  • Know the effect of mitosis & meiosis on allelic frequencies in nature
  • Be able to explain the effect on alleles when new members move into a population
  • Know the difference in prezygotic & postzygotic barriers
  • Be able to name & and give examples of prezygotic and postzygotic barriers
  • Be able to explain & give examples of mechanical and behavioral isolation
  • Know the difference between sympatric isolation and allopatric isolation
  • Be able to explain why such a great diversity of life exists on the Hawaiian & Galapagos Islands
  • Be able to tell the difference between anagenesis & cladogenesis
  • Know what taxonomic level can exist as a discrete unit in nature
  • Know what taxonomic unit would show the most genetic variation
  • Be able to explain & give an example of adaptive radiation
  • Be able to determine the age of a fossil using the half-life of carbon-14
  • Know what major evolutionary episode occurred closely with the formation of Pangaea
  • Be able to explain phylogeny
  • Know the significance of the asteroid hypothesis
  • Be able to explain & give examples of divergent & convergent evolution