AP Biology: CHAPTER 12
CELL CYCLE
1. What is meant by the concept that cells go through a cell cycle?
__________________________________________________________________________
__________________________________________________________________________
2. What are the key roles of cell division?
__________________________________________________________________________
__________________________________________________________________________
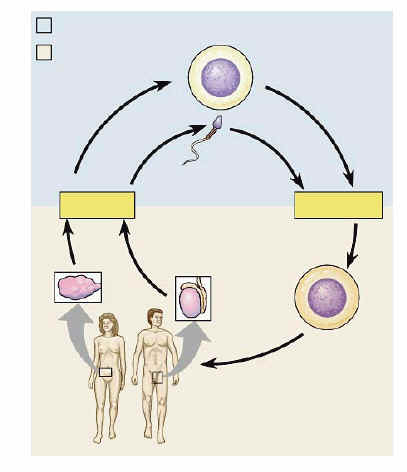
3. What is the significance of chromosome replication?
__________________________________________________________________________
__________________________________________________________________________
4. Sketch and label replicated chromosomes.
5. List the phases of the cell cycle with a brief description of what occurs in each phase.
a. _______________________________________________________________________
b. _______________________________________________________________________
c. _______________________________________________________________________
d. _______________________________________________________________________
e. _______________________________________________________________________
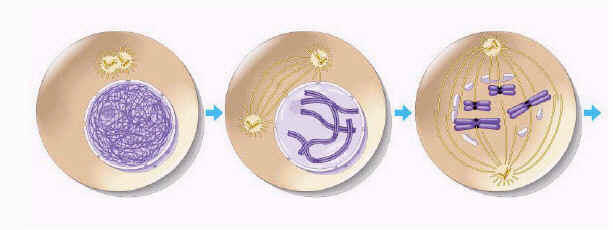
6. Label the stages and key features of each stage.

7. How does the spindle apparatus distribute chromosomes to the daughter cells?
__________________________________________________________________________
__________________________________________________________________________
8. What is the role of the kinetochores and the microtubules?
__________________________________________________________________________
__________________________________________________________________________
9. How does cytokinesis differ in animal and plant cells? Label the diagrams below.
__________________________________________________________________________
__________________________________________________________________________
__________________________________________________________________________

10. Eukatyotic mitosis is thought to have evolved from _________________________________
11. Why is the regulation of the cell cycle critical to normal cells?
__________________________________________________________________________
__________________________________________________________________________
12. What is the G1 checkpoint and where does it fit into the cycle?
__________________________________________________________________________
__________________________________________________________________________
13. What evidence is there that regulation is chemical in nature?
__________________________________________________________________________
__________________________________________________________________________
__________________________________________________________________________
14. Identify the role of the following in the cell cycle clock:
a. Kinase _________________________________________________________________
__________________________________________________________________________
b. Cyclin _________________________________________________________________
__________________________________________________________________________
c. CDKs _________________________________________________________________
__________________________________________________________________________
15. Describe the mechanism for regulating the passage of the cell into anaphase.
__________________________________________________________________________
__________________________________________________________________________
16. Describe what triggers mitosis from G2.
__________________________________________________________________________
__________________________________________________________________________
17. What is the role of ubiquitin?
__________________________________________________________________________
__________________________________________________________________________
__________________________________________________________________________
18. Describe a model for an external signal for growth.
__________________________________________________________________________
__________________________________________________________________________
__________________________________________________________________________
19. What happens when cancer develops?
__________________________________________________________________________
__________________________________________________________________________
__________________________________________________________________________
__________________________________________________________________________
20. What is the role of p53?
__________________________________________________________________________
__________________________________________________________________________
__________________________________________________________________________