This page uses frames, but your browser doesn’t support them.
Category: My Classroom Material
Karyotype Lab
| Karyotype lab | 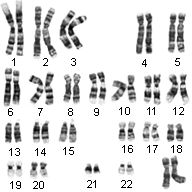 |
Introduction:
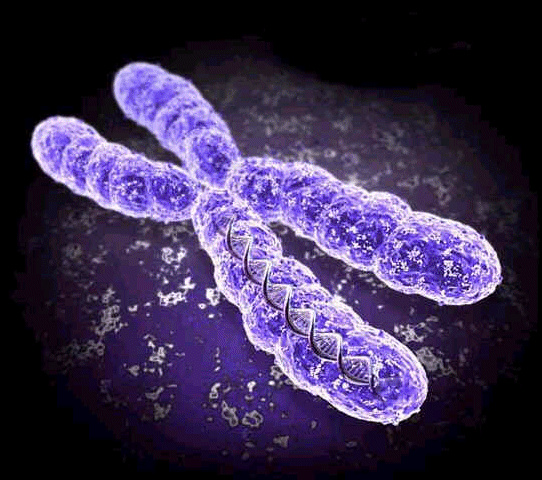
We can learn a lot by looking at chromosomes! They can tell us everything from the likelihood that an unborn baby will have a genetic disorder to whether a person will be male or female. Scientists often analyze chromosomes in prenatal testing and in diagnosing specific diseases. Fetal cells from an unborn child are contained in the amniotic fluid and can be tested for hereditary disorders such as Tay-Sachs or Phenylketonuria. Chromosomes are compact spools of DNA. If you were to stretch out all the DNA from one of your cells, it would be over 3 feet (1 meter) long from end to end! You can think of chromosomes as “DNA packages” that enable all this DNA to fit in the nucleus of each cell. Normally, we have 46 of these packages in each cell; we received 23 from our mother and 23 from our father. A karyotype is an organized profile of a person’s chromosomes. In a karyotype, chromosomes are arranged and numbered by size, from largest to smallest. This arrangement helps scientists quickly identify chromosomal alterations that may result in a genetic disorder.
To make a karyotype, scientists take a picture of someone’s chromosomes, cut them out and match them up using size, banding pattern and centromere position as guides. Homologous pairs are arranged by size in descending order (largest to smallest) with the sex chromosomes (XX for female or XY for male) as the last or 23 pair. Homologous chromosomes have genes for the same trait at the same location.

Since humans have 46 chromosomes in their somatic or body cells, they have 23 pairs of chromosomes in their karyotype. If chromosomes fail to separate in meiosis, a condition called nondisjunction, a person may have more or less than the normal 46 chromosomes on their karyotype. A disorder called Down Syndrome would be a example of this. A person with Down Syndrome will have 3 chromosomes in their 21st pair. The image below shows chromosomes as they are seen on the slide (left panel) and after arrangement (right panel).

karyotype background (run on colored paper), 1-3 sheets of numbered chromosomes, stick glue, scissors, envelope, black ink pen or fine-point marker
Procedure:
- Use your assigned sex and chromosome condition to determine how many of each chromosome you will need for your karyotype. (Assigned conditions include Normal male, Normal female, Female with Turner Syndrome, Male with Klinefelter’s Syndrome, Female with Down Syndrome, Male with Down Syndrome, Female with three X chromosomes, Male with no X chromosome, female with Cri-du-chat, Male with Cri-du-chat)
- Cut out this number of chromosomes keeping the homologous pairs together. (Do not cut off the chromosome numbers until you are ready to glue the chromosomes to your karyotype sheet.)
- Start arranging the chromosome pairs on the construction paper karyotype sheet in descending order by their size. Do not glue the chromosomes until all of them are arranged correctly.
- Evenly space out 4 rows of chromosomes on your karyotype sheet. Row 1 should contain pairs 1-6, row 2 has pairs 7-12, row 3 has pairs 13-18, and row 4 pairs 19 through the sex chromosomes.
- If any additional chromosomes are needed to complete your karyotype, cut these out from additional chromosome sheets.
- Make sure ALL PAIRS are in the same direction with their SHORTER END TOWARDS THE TOP OF THE CONSTRUCTION PAPER.
- Cut off the numbers from one homologous pair of chromosomes at a time and glue that pair to your construction paper karyotype sheet.
- With your ink pen or marker, neatly number each pair 1-23 below the glued pair.
- In the lower left corner of your karyotype, write the sex of your individual and their genetic condition (normal, Cri-du-chat, Down’s…).
- In the lower right corner, write the total number of chromosomes for this person.
Karyotype Template: (Click here for additional templates)
Questions & Observations:
- What is a karyotype?
2. How can a karyotype be useful to a couple wanting to have children?
3. What makes up chromosomes?
4. How is a karyotype of an unborn infant obtained?
5. What was the sex of the individual you were assigned?
6. What is this person’s GENOTYPE for sex?
7. What is a mutation?
8. What mutation, if any, occurred in this person’s karyotype?
9. How many chromosomes are in a somatic or body cell of this individual?
10. How many chromosomes are in a gamete or sex cell of this individual?
11. How many chromosomes are in a normal person’s somatic cells?
12. How many chromosomes are in a normal person’s gametes?
13. How many UNPAIRED chromosomes are their in this organism’s somatic cells?
14. What is the sex of an individual with 23 MATCHED pairs of chromosomes?
15. What is the diploid number for this organism?
16. Explain nondisjunction.
17. Name and explain 3 disorders due to nondisjunction of chromosomes.
Koch Postulates & Fungal Disease
| Koch’s Postulates |  |
Introduction:
In the late nineteenth century, German scientist Robert Koch established a set of procedures to isolate and identify the causative agent of a particular microbial disease. The following four steps, which are still used today, are known as Koch’s Postulates.
- A specific organism must be always be observed in association with the disease.
- The organism must be isolated from an infected host and grown in pure culture in the laboratory.
- When organisms from the pure culture are inoculated into a susceptible host organism, it must cause the disease.
- The infectious organism must be re-isolated from the diseased organism and grown in pure culture.
Objective:
In this investigation, your group will demonstrate Koch’s Postulates by using oranges as the host organisms. The infectious agent will be Penicillium notatum, a mold. You will isolate the culture on petri dishes of Potato Dextrose Agar.
Materials:
Penicillium notatum mold, 3 oranges, incubator, 10% bleach solution, apron, gloves, paper towels, detergent, small scrub brush, wide-mouth jar, portable burner, dissecting needle, large Ziplock bags, permanent marker, petri dish, potato dextrose agar, sterile swab
Click here for Aseptic Techniques
Procedure – Part A:
Postulate 1. A specific organism must be always be observed in association with the disease.
1. Disinfect the work area.
2. Obtain an orange and wash it thoroughly in cool, soapy water, scrubbing with a scrub brush. Rinse well.
3. Place the orange in a jar and cover with a 10% bleach solution. Let it stand for 10 minutes.
4. Rinse the orange for 10 minutes.
5. Flame a dissecting needle and allow it to cool. Then pierce the skin of the orange three or four times with the needle.
6. Flame the mouth of the tube of fungus and, using a sterile swab, aseptically remove a small sample and smear it over the puncture wounds in the orange.
7. Place the orange in a Ziploc bag. Label with your group number and date. The bag will be allowed to remain at room temperature or in an incubator at 25oC for about a week.
7. Prepare a data chart (Figure 1) to record daily observations. The chart should have places for the date, room temperature or incubator temperature, description of changes in the orange, and sketches.
8. Each day, record in a data chart your observations of the orange and the progress of the infection.
FIGURE 1:
| Date | Room/Incubator Temperature | Observations |
|
|
||
|
|
||
|
|
||
|
|
||
|
|
Procedure – Part B
Postulate 2. The organism must be isolated from an infected host and grown in pure culture in the laboratory.
During the week or so of incubation, you should see a white powdery spore mass on the orange that soon changes to a greenish color. When the green appears, it is time to isolate the pathogen.
1. Disinfect work area.
2. Obtain a petri dish of Potato Dextrose Agar. Label the bottom of the plate with your group number and the date.
3. With a sterile swab, aseptically transfer some of the spore mass to the plate of Potato Dextrose Agar. Streak across the plate in parallel lines.
4. Incubate the plates upside down at room temperature or in an incubator at 25oC for 5 – 7 days until the mold produces spores.
5. Make another data chart (Figure 2) to record observations of the growth on the petri dish.
6. Each day, record in a data chart your observations of the growth in the petri dish. (Do not remove the cover of the dish when making observations.)
FIGURE 2:
| Date | Room/Incubator Temperature | Observations |
|
|
||
|
|
||
|
|
||
|
|
||
|
|
Procedure – Part C:
Postulate 3. When organisms from the pure culture are inoculated into a susceptible host organism, it must cause the disease.
Once the culture in the petri dish has produced spores, you can inoculate susceptible organisms.
1. Disinfect work area.
2. Obtain two oranges and scrub them thoroughly in cool, soapy water. Rinse well.
3. Place the oranges in a jar and cover with a 10% bleach solution. Let stand for 10 minutes.
4. Rinse the oranges for 10 minutes.
5. Flame a dissecting needle and allow it to cool. Then pierce the skin of each orange three or four times with the needle.
6. Using a sterile swab, aseptically remove a small sample of mold spores from the petri dish. Smear it over the puncture wounds in one of the oranges.
7. Place the oranges in separate Ziploc bags. Label with your group number and date. Label the orange that is NOT inoculated, “CONTROL.” The bags will be allowed to remain at room temperature or in an incubator at 25oC for about a week.
8. Prepare a data chart (Figure 3) to record daily observations.
9. Each day, record in the data chart your observations of the oranges and the progress of the infection.
FIGURE 3:
| Date | Room/Incubator Temperature | Observations |
|
|
||
|
|
||
|
|
||
|
|
||
|
|
Procedure – Part D:
Postulate 4. The infectious organism must be re-isolated from the diseased organism and grown in pure culture.
When the spore mass appears on the inoculated orange, it is time to re-isolate the culture.
1. Disinfect work area.
2. Aseptically transfer a sample of the spores from the inoculated orange from Procedure 3 to a petri dish of Potato Dextrose Agar. Label the plate.
3. Incubate for the same length of time that you incubated in Procedure 2.
4. Make a data chart (Figure 4) to record your observations.
6. Each day, record in the data chart your observations of the growth in the petri dish.
FIGURE 4:
| Date | Room/Incubator Temperature | Observations |
|
|
||
|
|
||
|
|
||
|
|
||
|
|
Analysis:
1. What is the importance of Koch’s Postulates?
2. Why have Koch’s Postulates remained unchanged for over a century?
3. Why were oranges and a mold used in this investigation?
4. Why were you instructed to scrub the oranges with a brush?
5. What was the reason you punctured the control orange?
6. What led you to the conclusion that the same organism caused the infection each time? Be sure that your data sheets support your answer.
7. Other than observations of appearance, what further investigations might have been done to prove that the organism that grew on the plates in Procedure 4 was the same one that you started with in Procedure 1?
AP Lab 2 Report 2001
Enzyme Catalysis
 |
Introduction
Enzymes are proteins produced by living cells that act as catalysts, which affect the rate of a biochemical reaction. They allow these complex biochemical reactions to occur at a relatively low temperature and with less energy usage.
In enzyme-catalyzed reactions, a substrate, the substance to be acted upon, binds to the active site on an enzyme to form the desired product. Each active site on the enzyme is unique to the substrate it will bind with causing each to have an individual three-dimensional structure. This reaction is reversible and is shown as following:
E + S—-ES—- E + P
Enzymes are recyclable and unchanged during the reaction. The active site is the only part of the enzyme that reacts with the substrate. However, its unique protein structure under certain circumstances can easily be denatured. Some of the factors that affect enzyme reactions are salt concentration, pH, temperature, substrate and product concentration, and activators and inhibitors.
Enzymes require a very specific environment to be affective. Salt concentration must be in an intermediate concentration. If the salt concentration is too low, the enzyme side chains will attract each other and form an inactive precipitate. Likewise, if the salt concentration is too high, the enzyme reaction is blocked by the salt ions. The optimum pH for an enzyme-catalyzed reaction is neutral (7 on the pH scale). If the pH rises and becomes basic, the enzyme begins losing its H+ ions, and if it becomes too acidic, the enzyme gains H+ ions. Both of these conditions denature the enzyme and cause its active site to change shape.
Enzymes also have a temperature optimum, which is obtained when the enzyme is working at its fastest, and if raised any further, the enzyme would denature. For substrate and product concentrations, enzymes follow the law of mass action, which says that the direction of a reaction is directly dependent on the concentration. Activators make active sites better fit a substrate causing the reaction rate to increase. Inhibitors bind with the enzymes’ active site and block the substrate from bonding causing the reaction to subside.
The enzyme in this lab is catalase, which produced by living organisms to prevent the accumulation of toxic hydrogen peroxide. Hydrogen peroxide decomposes to form water and oxygen as in the following equation:
2H2O2 ® 2H2O + O2
This reaction occurs spontaneously without catalase, but the enzyme speeds the reaction considerably. This lab’s purpose is to prove that catalase does speed the decomposition of hydrogen peroxide and to determine the rate of this reaction.
Hypothesis
The enzyme catalase, under optimum conditions, effectively speeds the decomposition of hydrogen peroxide.
Materials
Exercise 2A: Test of Catalase Activity
In Part 1, the materials used were 10mL of 1.5% H2O2, 50-mL glass beaker, 1 mL catalase, and 2 10-mL pipettes and pipette pumps. In Part 2, the materials used were 5 mL of catalase, a boiling water bath, 1 test tube, a test tube rack, 10 mL of 1.5% H2O2, 50-mL beaker, and 2 10-mL pipettes and pipette pumps. In Part 3, the materials used were 10 mL of 1.5% H2O2, 50-mL beaker, liver, and a syringe.
Exercise 2B: The Baseline Assay
This part of the lab required 10 mL of 1.5% H2O2, 1 mL distilled H2O, 10 mL of H2SO4, 2 50-mL beakers, a sheet of white paper, 5 mL KMnO4, 2 5-mL syringes, and 2 10-mL pipettes and pumps.
Exercise 2C: The Uncatalyzed Rate of H2O2 Decomposition
The materials used for this section were 15 mL of 1.5% H2O2, 1 mL distilled H2O, 10 mL H2SO4, 2 50-mL beakers, a sheet of white paper, 5 mL KMnO4, 2 5-mL syringes, and 2 10-mL pipettes and pumps.
Exercise 2D: An Enzyme-Catalyzed Rate of H2O2 Decomposition
The materials required for Exercise 2D were 70 mL of 1.5% H2O2, 70 mL of H2SO4, 6 mL of catalase solution, 13 plastic, labeled cups, 3 100-mL beakers, 1 50-mL beaker, 1 10-mL syringe, 1 5-mL syringe, 1 60-mL syringe, a sheet of white paper, a timer, and 30 mL of KMnO4.
Method
Exercise 2A: Test of Catalase Activity
In Part 1, 10 mL of 1.5% H2O2 were transferred into a 50-mL beaker. Then, 1 mL of fresh catalase solution was added and the reaction was observed and recorded. In Part 2, 5 mL of catalase was placed in a test tube and put in a boiling water bath for five minutes. 10 mL of 1.5% H2O2 were transferred to a 50-mL beaker and 1 mL of the boiled catalase was added. The reaction was observed and recorded. In Part 3, 10mL of 1.5% H2O2 were transferred to a 50 mL beaker. 1 cm3 of liver was added to the beaker and the reaction was observed and recorded.
Exercise 2B: The Baseline Assay
10 mL of 1.5% H2O2 were transferred to a 50-mL beaker. 1 mL of H2O was added instead of catalase, and then, 10 mL of H2SO4 were added. After mixing well, a 5 mL sample was removed and placed over a white sheet of paper. A 5-mL syringe was used to add KMnO4, 1 drop at a time until a persistent brown or pink color was obtained. The solution was swirled after every drop, and the results were observed and recorded. The baseline assay was calculated.
Exercise 2C: The Uncatalyzed Rate of H2O2 Decomposition
A small quantity of H2O2 was placed in a beaker and stored uncovered for approximately 24 hours. To determine the amount of H2O2 remaining, 10 mL of 1.5% H2O2 were transferred to a 50-mL beaker. 1 mL of H2O was added instead of catalase, and then, 10 mL of H2SO4 were added. After mixing well, a 5 mL sample was removed and placed over a white sheet of paper. A 5-mL syringe was used to add KMnO4, 1 drop at a time until a persistent brown or pink color was obtained. The solution was swirled after every drop, and the results were observed and recorded. The percent of the spontaneously decomposed H2O2 was calculated.
Exercise 2D: An Enzyme-Catalyzed Rate of H2O2 Decomposition
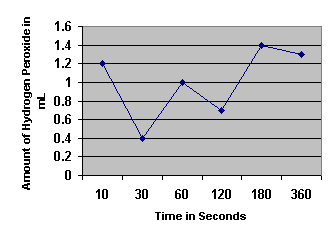
The baseline assay was reestablished following the directions of Exercise 2B. Before starting the actual experiment a lot of preparation was required. Six labeled cups were set out according to their times and 10 mL of H2O2 were added to each cup. 6 mL of catalase were placed in a 10-mL syringe, and 60 mL of H2SO4 were placed in a 60-mL syringe. To start the actual lab, 1 mL of catalase was added to each of the cups, while simultaneously, the timer was started. Each of the cups were swirled. At 10 seconds, 10 mL of H2SO4 were added to stop the reaction. The same steps were repeated for the 30, 60, 120, 180, and 360 second cups, respectively.
Afterwards, a five 5 mL sample of each of the larger cups were moved to the corresponding labeled smaller cups. Each sample was assayed separately by placing each over a white sheet of paper. A 5-mL syringe was used to add KMnO4, 1 drop at a time until a persistent brown or pink color was obtained. The solution was swirled after every drop, and the results were observed and recorded.
Results
Table 1
Enzyme Activity
|
Activity |
Observations |
| Enzyme activity | The solution only bubbled slightly and slowly. |
| Effect of Extreme temperature
|
The catalase had no reaction with the H2O2; there were no bubbles |
| Presence of catalase | The solution foamed up immediately |
Table 2
Establishing a Baseline
|
Volume |
|
|
Initial reading
|
5.0 mL |
|
Final reading
|
0.8 mL |
|
Baseline ( final volume – initial volume)
|
4.2 mL |
Table 3
Rate of Hydrogen Peroxide Spontaneous Decomposition
|
Volume |
|
|
Initial KMnO4
|
5.0 mL |
|
Final KMnO4
|
1.2 mL |
|
Amount of KMnO4 used after 24 hours
|
3.8 mL |
|
Amount of H2O2 spontaneously decomposed |
0.4 mL |
|
Percent of H2O2 spontaneously decomposed |
9.52% |
Table 4
Rate of Hydrogen Peroxide Decomposition by Catalase
| Time ( Seconds) | ||||||
| 10 | 30 | 60 | 120 | 180 | 360 | |
|
Baseline KMnO4
|
4.0 mL |
4.0 mL |
4.0 mL |
4.0 mL |
4.0 mL |
4.0 mL |
|
Initial volume KMnO4
|
5.0 mL |
5.0 mL |
5.0 mL |
5.0 mL |
5.0 mL |
5.0 mL |
|
Final volume KMnO4
|
2.2 mL |
1.4 mL |
2.0 mL |
1.7 mL |
2.4 mL |
2.3 mL |
|
Amount KMnO4 used |
2.8 mL |
3.6 mL |
3.0 mL |
3.3 mL |
2.6 mL |
2.7 mL |
|
Amount H2O2 used |
1.2 mL |
0.4 mL |
1.0 mL |
0.7 mL |
1.4 mL |
1.3 mL |
Amount of Hydrogen Peroxide Decomposed by Catalase
Exercise 2A: Test of Catalase Activity
1. Observing the reaction of catalase on hydrogen peroxide:
a. What is the enzyme in this reaction? catalase
b. What is the substrate in this reaction? Hydrogen peroxide
c. What is the product in this reaction? Oxygen & water
d. How could you show that the gas evolved is O2? The gas could be shown to be O2 if the gas were collected in a tube, and a glowing splint was held in the tube. If the splint glowed, it would prove the gas was oxygen.
2. Demonstrating the effect of boiling on enzyme action:
a. How does the reaction compare to the one using the unboiled catalase? Explain the reason for this difference. While the unboiled catalase caused bubbles to form in the solution, the boiled catalase did not react at all because boiling an enzyme causes the protein to unfold and therefore denatures it.
3. Demonstrating the presence of catalase in living tissue:
a. What do you think would happen if the potato or liver was boiled before being added to the H2O2? The catalase in the liver would have been denatured by the boiling and would not have reacted with the H2O2.
Analysis of Results
1. Determine the initial rate of the reaction and the rates between each of the time points.
|
Time Intervals (Seconds) |
||||||
|
Initial 0 to 10 |
10 to 30 |
30 to 60 |
60 to 120 |
120 to 180 |
180 to 360 |
|
|
Rates |
0.12 mL/sec |
-0.04 mL/sec |
0.02 mL/sec |
-0.005 mL/sec |
0.01167 mL/sec |
-0.00083 mL/sec |
2. When is the rate the highest? Explain why.
The rate is the highest in the initial ten seconds because the concentration of catalase is at its highest. As more of the product is formed, it blocks the reaction between the catalase and the hydrogen peroxide.
3. When is the rate the lowest? For what reasons is the rate low?
The rate is lowest during the 180-360 seconds time period because of the law of mass action. This law says that when there is a high concentration of product as in this period, the enzymes will be blocked by the product (water) from reaching and reacting with the substrate (H2O2).
4. Explain the inhibiting effect of sulfuric acid on the function of catalase. Relate this to enzyme structure and chemistry
Sulfuric acid has an inhibiting effect on catalase function because it causes the pH level in the solution to lower considerably. Acidic solutions cause the protein structure of the enzyme to gain H+ ions causing it to denature.
5. Predict the effect lowering the temperature would have on the rate of enzyme activity. Explain your prediction.
Lowering the temperature of the catalase would slow the rate of reaction until it finally caused the enzyme to denature, and it would no longer react with the substrate. Most enzymes are only affective in a temperature range between 40° – 50° C.
6. Design a controlled experiment to test the effect of varying pH, temperature, or enzyme concentration.
Part 1: Enzyme Activity at Room Temperature
Add 10 mL of 1.5% H2O2 to a 50-mL beaker, and add 1 mL of room temperature catalase. Mix well and add 10 mL of H2SO4. Watch the reaction and record the results.
Part 2: The Effect of Excessive Heat on Enzyme Activity
Put 5 mL of catalase into a test tube and heat thoroughly over a Bunsen burner. Add 1 mL of the heated catalase to 10 mL of 1.5% H2O2 in a 50-mL beaker. Add 10 mL of H2SO4. Watch the reaction and record the results.
Part 3: The Effect of Excessive Cooling on Enzyme Activity
Put 5 mL of catalase in a freezer until completely frozen. Add 1 mL of the frozen catalase to 10 mL of 1.5% H2O2 in a 50-mL beaker. Add 10 mL of H2SO4. Watch the reaction and record the results.
Error Analysis
Any number of factors in this lab could have affected the results of this experiment. To get the desired results all of the measurements had to be precisely accurate and fully planned before hand. In Exercise D especially, the factor of planning became increasingly essential. The first attempt at 2D was unsuccessful due to several reasons. First of all, the measurements, which were taken, could have possibly been inaccurate and the 60-mL syringe containing H2SO4 also dripped into one of the cups early which did not allow the reaction to fully take place. There was also some confusion on the operation of the timer and precise planning in its use. The second attempt at 2D contained errors as well. The measurements were still not as accurate as they should have been, and the solution did not appear entirely uniform. In one cup, for example, the first drop of KMnO4 left a persistent pink color, and then after over a minute, it returned back to being clear. It then took several milliliters more to get it back to a pink color.
Discussion and Conclusion
This lab showed how catalase increased the rate of decomposition of hydrogen peroxide. In 2A, it was shown that catalase causes a visual reaction with H2O2, that when boiled catalase is no longer reactive, and that catalase is present in living tissue. Lab 2C shows that the natural decomposition of H2O2 is much slower than the enzymatic reaction. Lab 2D showed the decomposition of H2O2 over just a period of six minutes, and it had already decomposed more than the uncatalyzed H2O2 had done in 24 hours.
Lab & Ap Sample 2 Mitosis & Meiosis
Mitosis & Meiosis -AP lab 3

Introduction
Cells come from preexisting cells. New cells are formed during cell division which involves both replication of the cell’s nucleus, karyokinesis, and division of the cytoplasm, cytokinesis. The two kinds of cellular division are mitosis and meiosis. Mitosis usually makes body cells, somatic cells. Making an adult organism from an egg, asexual reproduction, regeneration, and the maintenance and repair of body parts are performed during mitotic cell division. This process called meiosis makes gametes, in animals, and spores, in plants. Gamete or spore cells have half the chromosomes that the parent cell has.
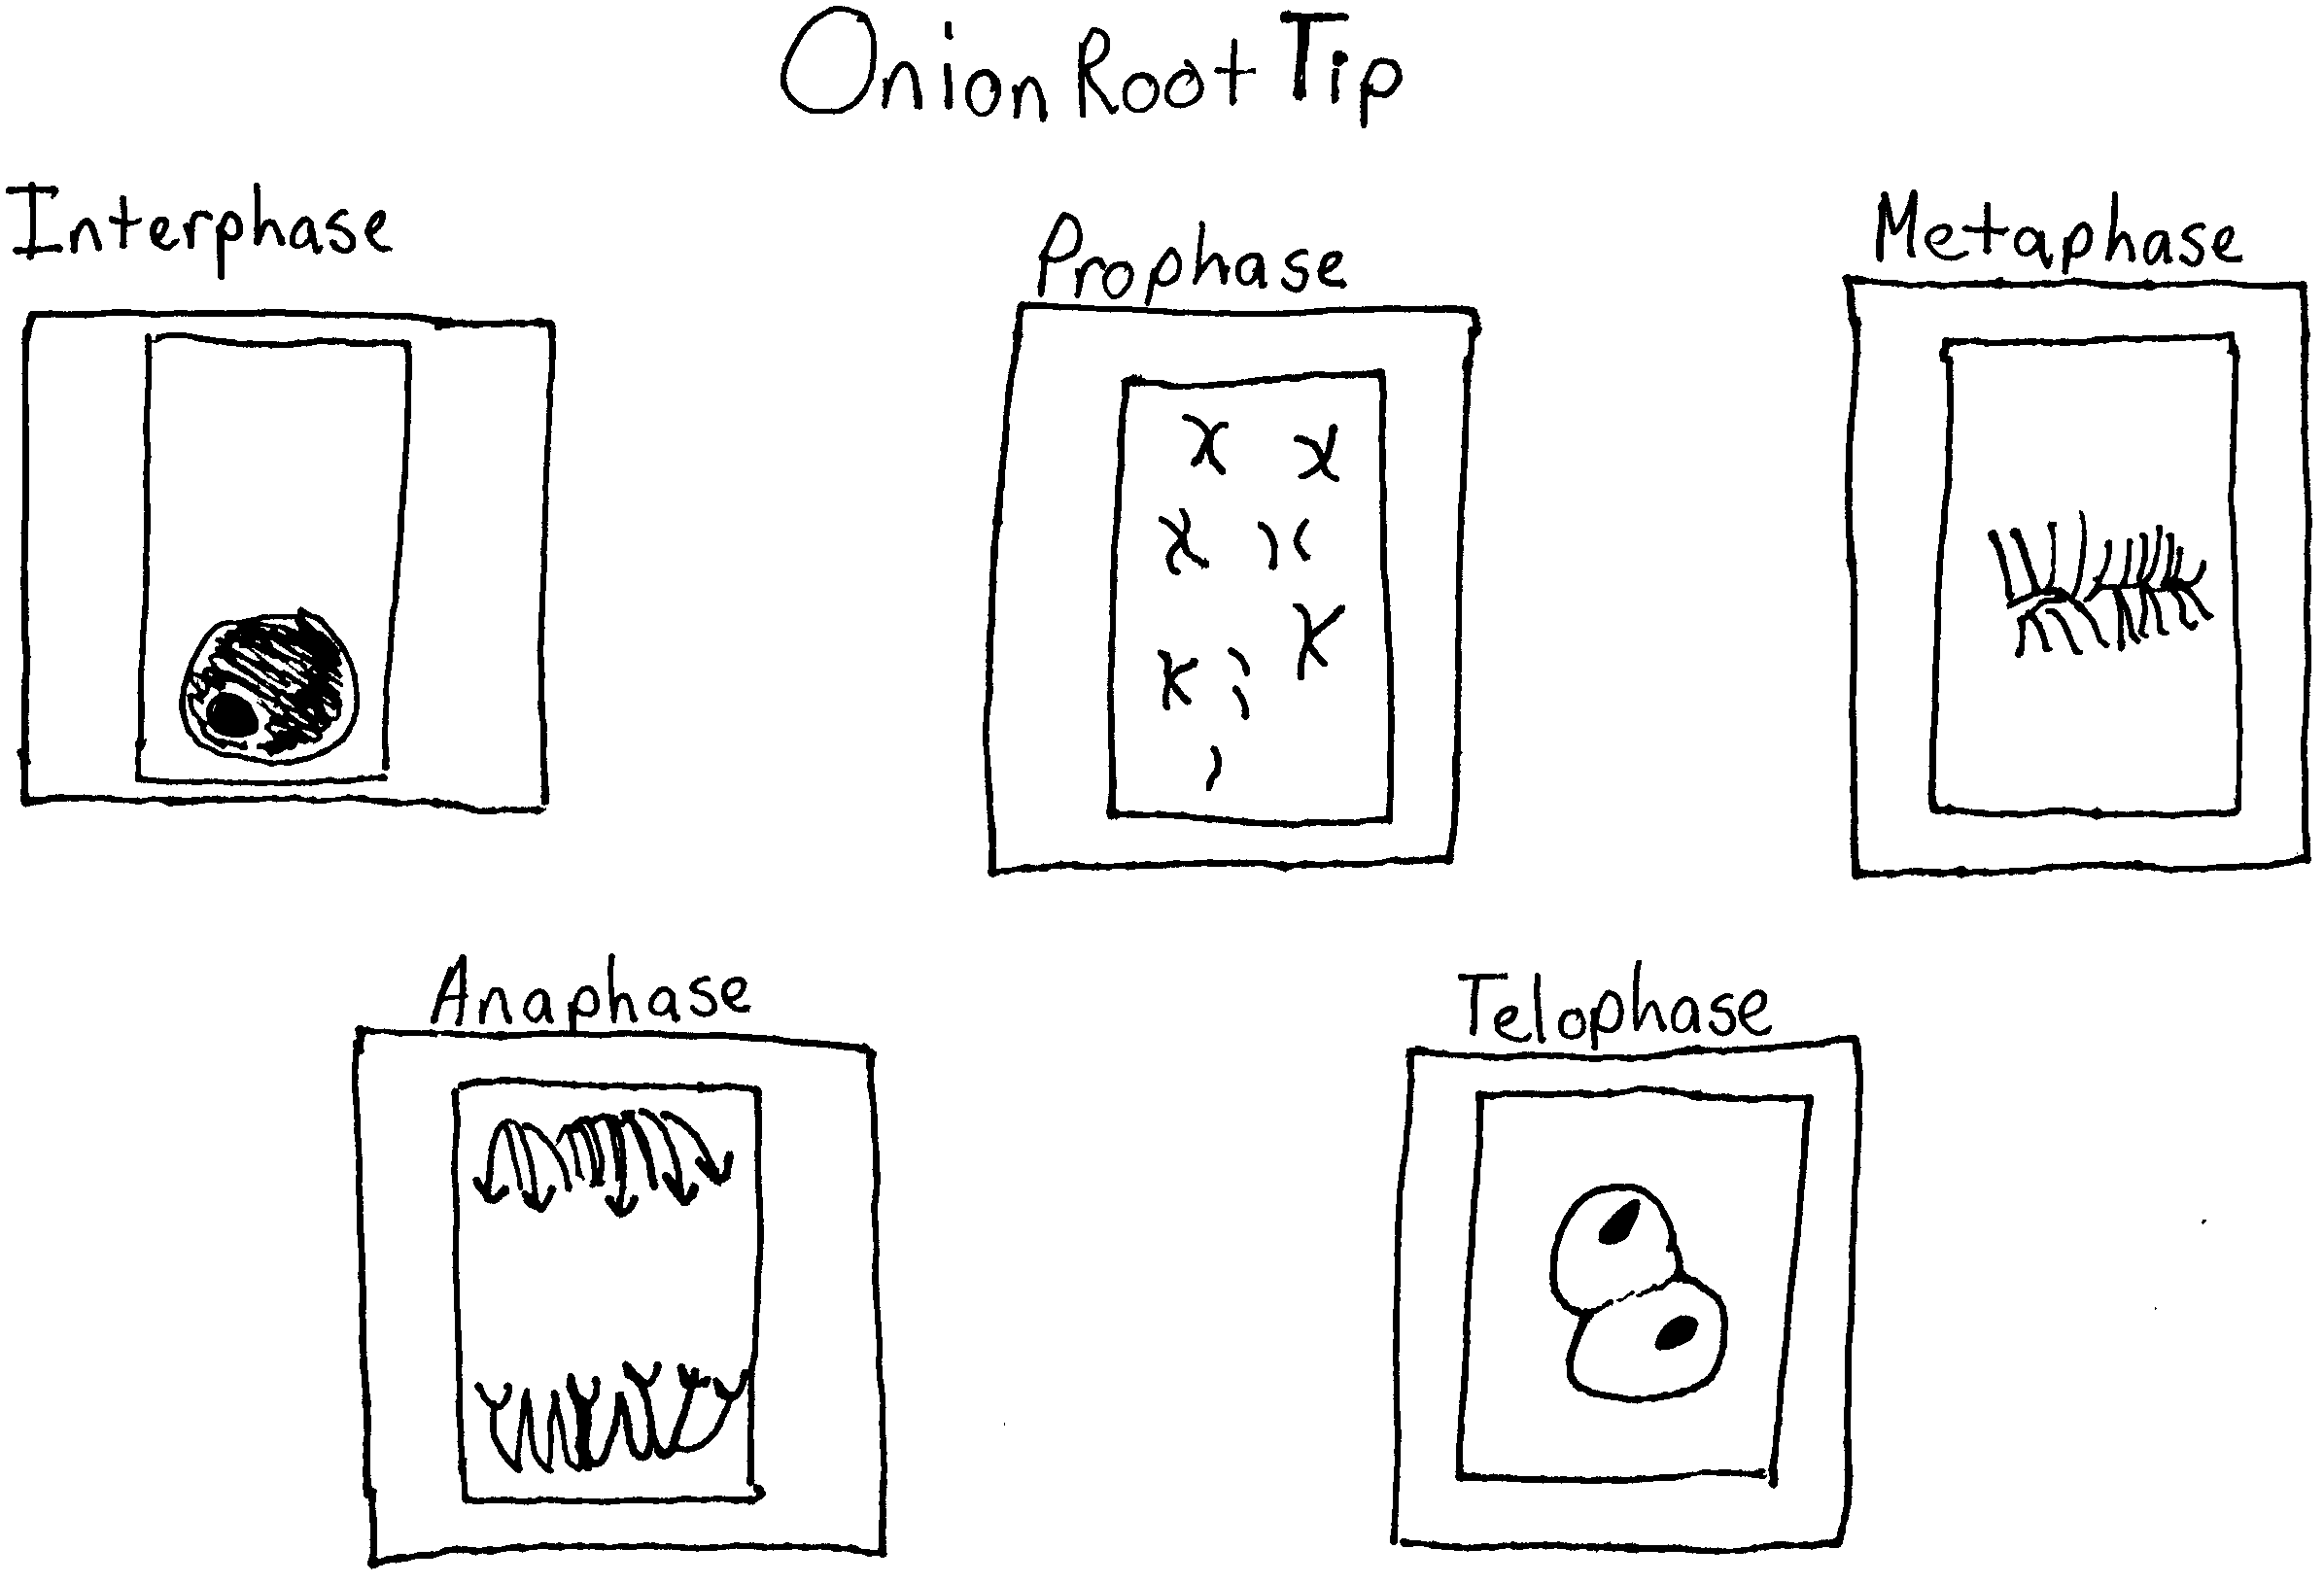
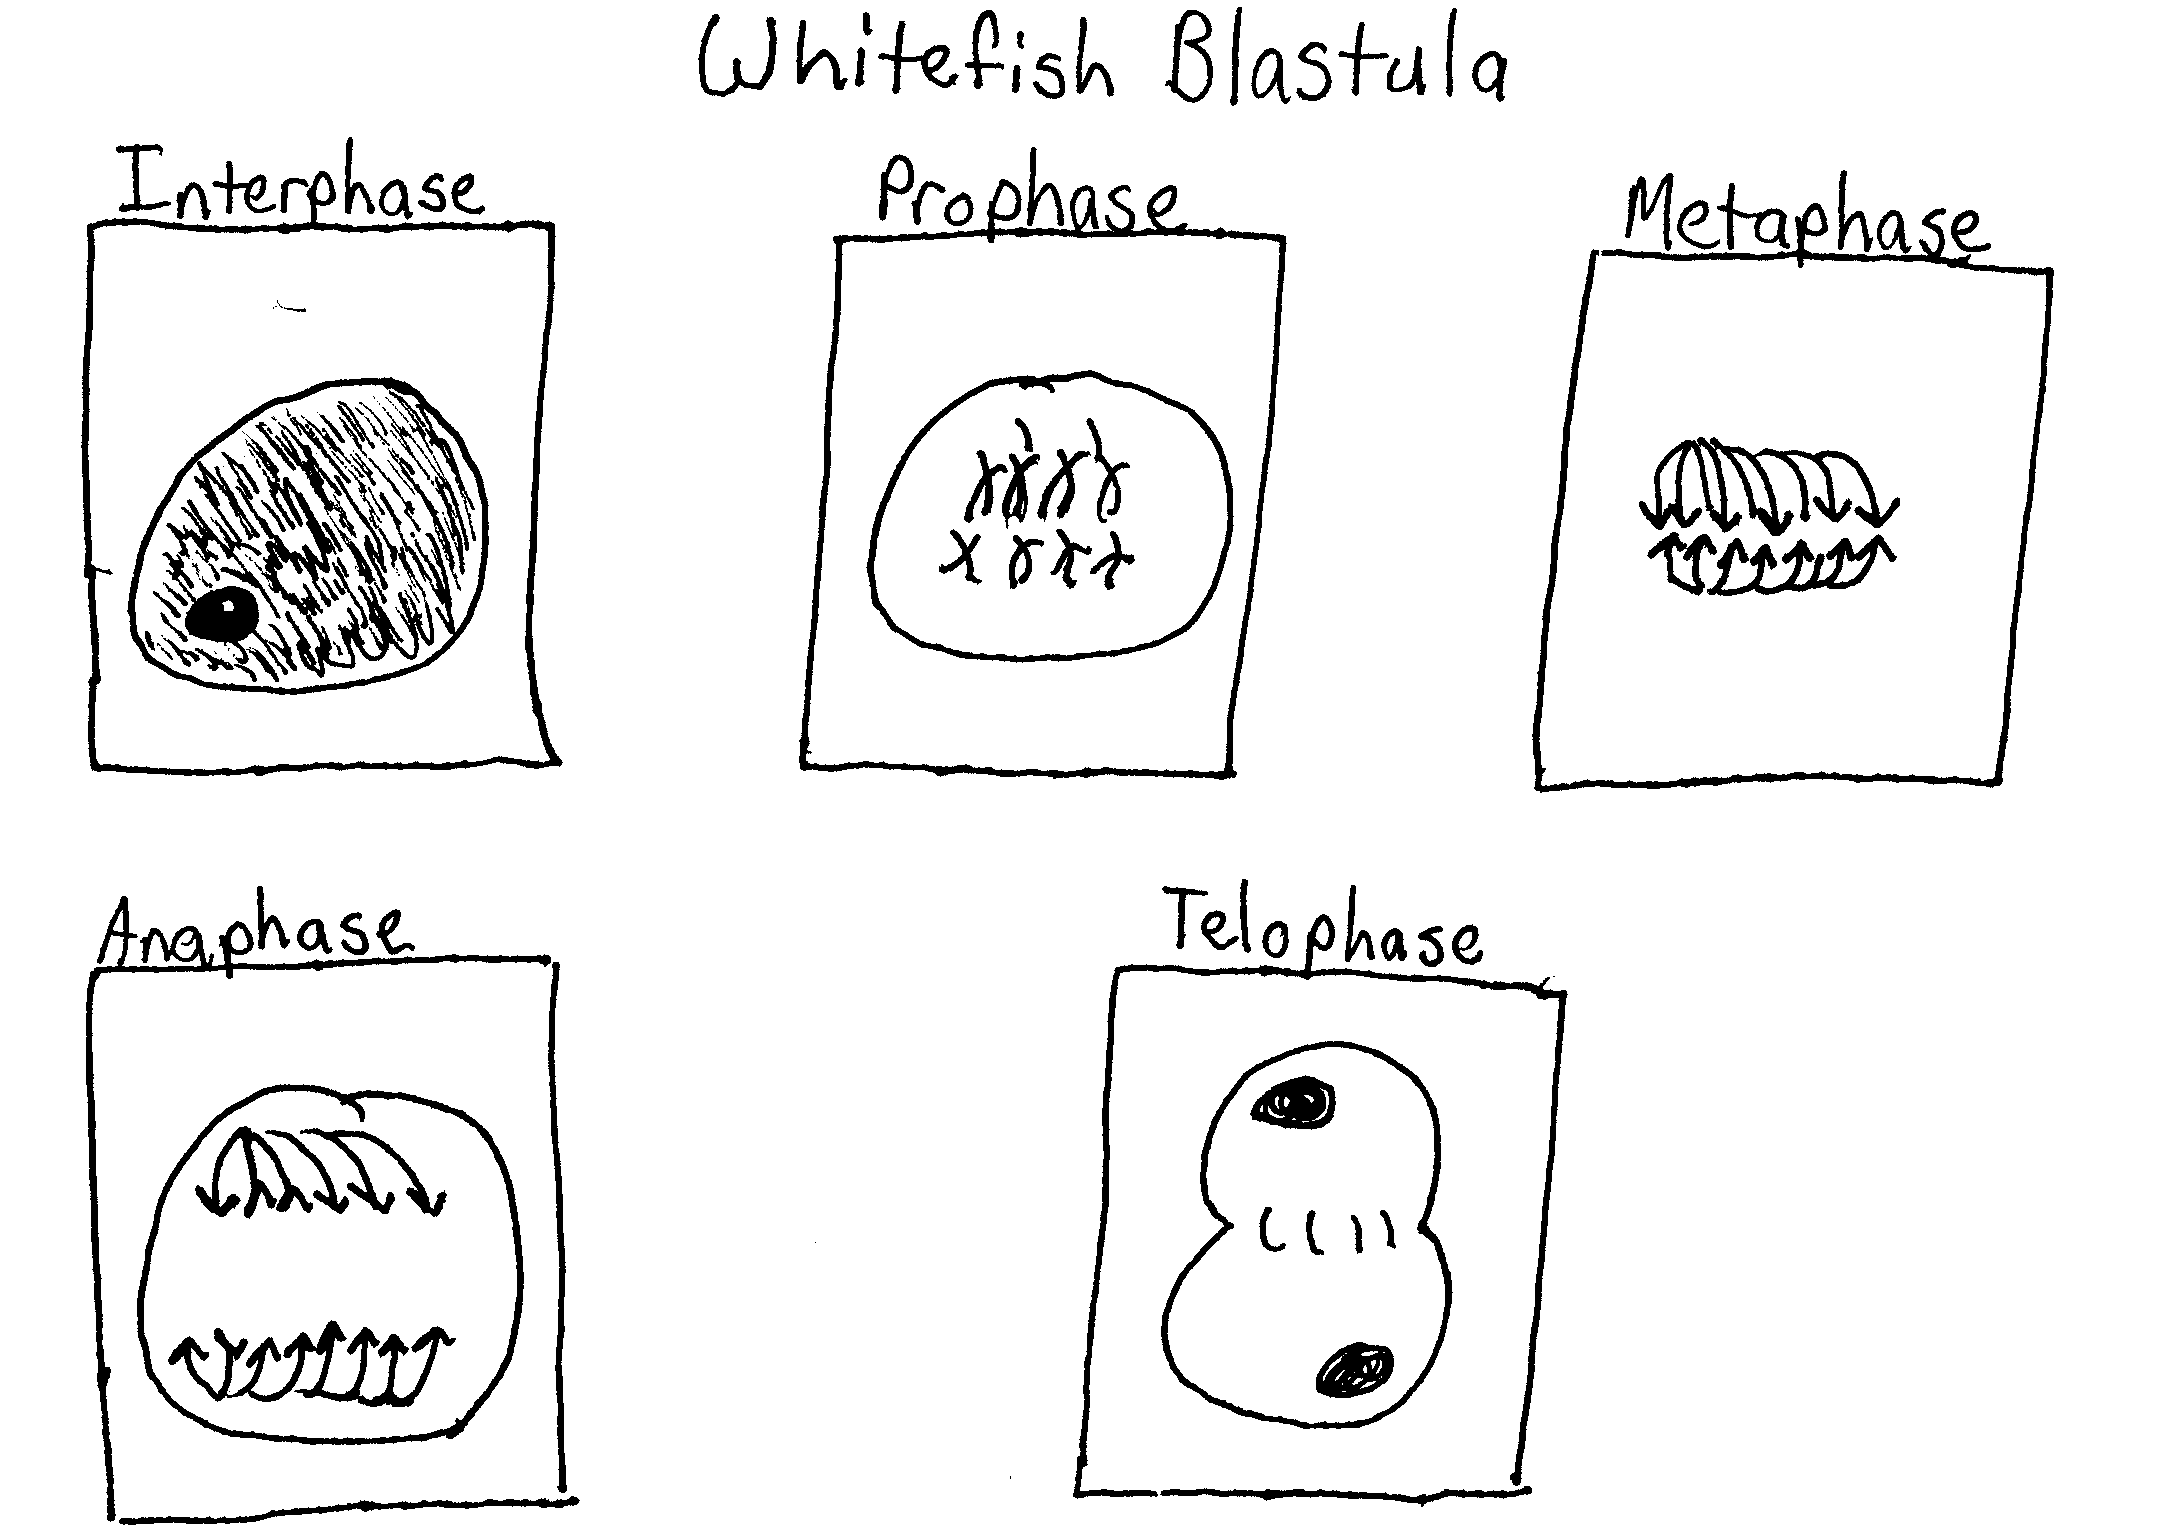
In plants mitosis takes place in the meristems which are normally found at the tips of stems or roots. However, in animal cells cell division takes place every where as new cells are formed and old ones are replaced. Studying mitosis can be accomplished by looking at tissues where there are many cells in a process of meiosis. Two examples are an onion root tip, or developing embryos, in animals such as whitefish blastula. A blastula is formed after an egg is fertilized and the egg begins to divide. There are several phases of the mitotic cell cycle. A precursor to mitosis is interphase. The actual steps of the mitotic cell cycle are prophase, metaphase, anaphase, and telophase. Interphase is a stage in the cell cycle in which the cell is not dividing. The nucleus contains a nucleolus and also contains chromatin. During interphase DNA replication occurs. The first phase of mitotic cell division is prophase. During prophase the chromatin begins to thicken until noticeable chromosomes are formed. Each chromosome has two chromatids that are joined at the centromere. During the later part of prophase, the nuclear envelope and nucleolus disappear. Mitotic spindle fibers, composed of microtubules, also become apparent. Following prophase is metaphase. By the time the cell has reached metaphase the chromosomes have moved to the center of the mitotic spindle. The centromere of the chromosome attaches to the spindle. The centromeres of each chromosome line up on an area called the metaphase plate. Metaphase is followed by anaphase. In the beginning of anaphase, the centromeres of each pair of chromatids separate and moved by the spindle fibers to the opposite ends of the cell. When the daughter chromosomes reach the ends of the cell the form a clump at each spindle pole. The final phase of mitosis is telophase. Telophase is identified by a recognizable condensation of the chromosomes, which is followed by the formation of a new nuclear envelope. The chromosomes slowly uncoil into chromatin once again and the nucleoli and nuclear envelope reform. It is then possible for cytokinesis, the division of the cytoplasm into two cells, to occur. In an animal cells a cleavage furrow forms and the cell pinches off into two new daughter cells.
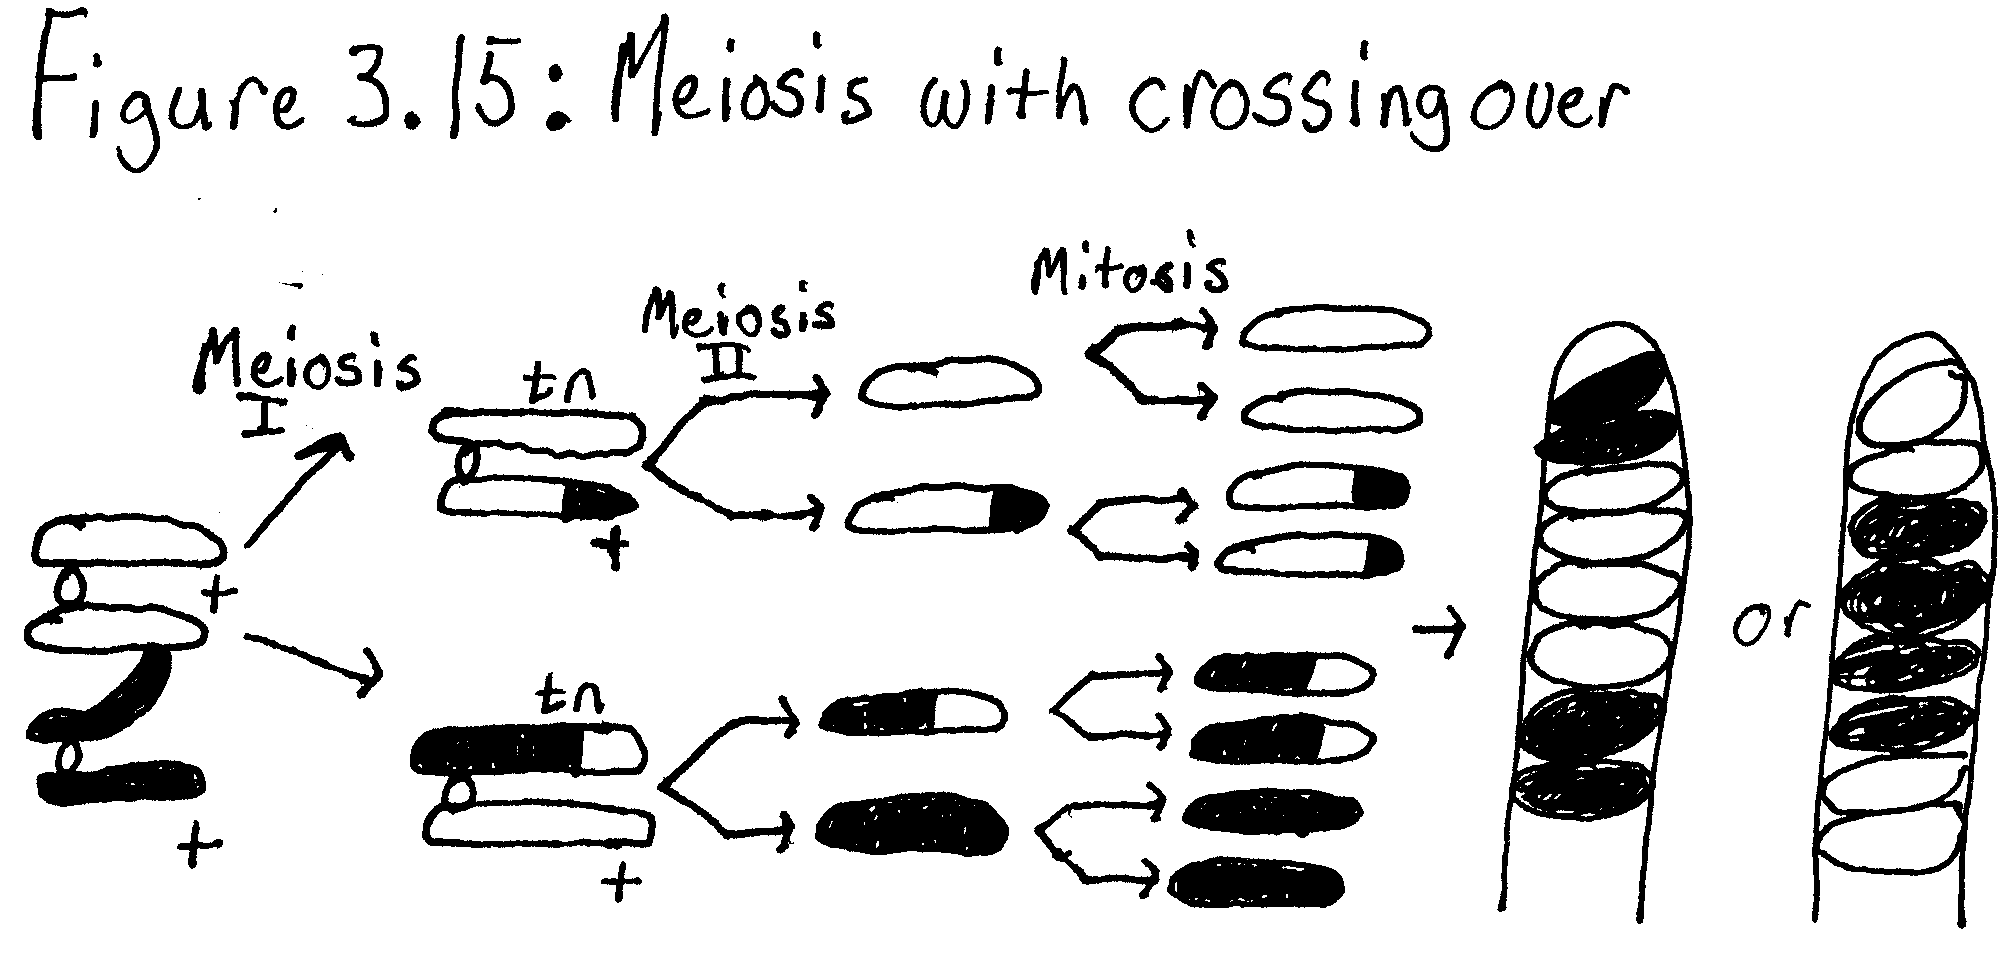
The process of meiosis involves two nuclear divisions that result in the formation of four haploid cells. Meiosis I, a reduction division, is the first division to reduce the chromosome number from diploid to haploid and separates the homologous pairs. Meiosis II separates the sister chromatids resulting in four haploid gametes. Unlike mitosis meiosis increases genetic variation. In meiosis I each pair of homologous chromosomes come together which is known as a synapse. Chromatids of homologous chromosomes may exchange parts which is called crossing over. The distance between two genes on a chromosome may be estimated by calculating the percentage of crossing over that takes place between them. Meiosis I is preceded by interphase. During interphase DNA synthesis occurs and each chromosome is made of two chromatids joined at the centromeres. The first step of meiosis I is prophase I. During prophase I homologous chromosomes come together and synapse. A tetrad consisting of four chromatids is also formed. Prophase I is followed by metaphase I. In metaphase I the crossed over tetrads line up in the center of the cell. In anaphase I the homologous chromosomes separate and are moved to opposite ends of the cell. The final phase of meiosis I is telophase I. During telophase I centriole duplication is completed. Most of the time cytokinesis and formation of the nuclear envelope occur in order two make to cells. Meiosis II a second mitotic cell division then takes place in order to separate the chromatids in the two daughter cells made in meiosis I. This reduces the amount of DNA to one strand per chromosome. This is the only difference between meiosis I and II. Before meiosis II there is period called interphase or interkenesis. DNA replication does not take place in interphase II. Interphase II is followed by prophase II, No DNA replication occurs in prophase II and replicated centrioles separate and move to opposite sides of the chromosome groups. During metaphase II the chromosomes are centered in the middle of each daughter cell. During anaphase II the centromere regions of the chromatids are separate. The last stage of meiosis II is telophase II. In telophase II the chromosomes are at opposite ends of the cell and a nuclear envelope forms, and sometimes the cytoplasm divides.
Sordaria fimicola is fungus that may be used to show the results of crossing over during meiosis. Sordaria throughout most of its life is haploid, but becomes diploid after the fusion of two different types of nuclei, which forms a diploid nucleus. In Sordaria meiosis results in the making of eight haploid ascospores found in a sac called an ascus. Most asci are found in a perithecium. The life cycle of Sordaria fimicola is as follows: a spore is discharged through an ascus. The ascospore then undergoes mitosis, which forms a filament. The filament then undergoes mitosis, which forms a mycelium. Mycelial fusion and fertilization then takes place. This forms a diploid zygote. The zygote undergoes mitosis to form four haploid nuclei. The nuclei also undergo mitosis and form eight haploid nuclei, which then form eight ascospores. When mycelia of a mutant strain of Sordaria and a wild type of Sordaria undergo meiosis four black and four tan ascospores form. The arrangement of the ascospores reflects whether crossing over has occurred or not. Gametes, egg and sperm, are made during meiosis. Each egg and sperm cell contains half the total chromosomes a normal cell of that species would have. When the egg and sperm unite during fertilization the total chromosome number is restored.
Exercise 3A.1 – Hypothesis
While looking at prepared slides of onion root tip cells and whitefish blastula cells under a microscope I will be able to identify and draw the stages of mitosis in these cells.
Materials
The materials used in this experiment were a light microscope and prepared slides of onion root tip cells and whitefish blastula cells.
Methods
Using the microscope examine the slides of onion root tip cells and whitefish blastula cells. Begin by locating the merismatic region of the onion or the blastula using the 10 X objective. Then use the 40 X objective to study individual cells. Identify one cell that clearly represents each phase. Sketch and label the cell on a separate piece of paper.
Exercise 3A.2 – Hypothesis
When undergoing mitosis most of the cells in an onion root tip will be in interphase. More cells will be in the stage of prophase than metaphase. More cells will be in metaphase than anaphase and more cells will be in anaphase than telophase.
Materials
The materials used in this experiment were a prepared slide of an onion root tip and a light microscope.
Methods
Obtain a prepared slide of an onion root tip and observe every cell in one high power field of view and determine which phase of the cell cycle it is in. Make sure to do this in pairs so one person can observe the cells and the other person can record which phase the cell is in. Make sure to count three full fields of view and at least 200 cells. Then, record your data in table 3.1. Next, calculate the percentage of cells in each phase by using the equation; percentage of cells in stage X 1,440 minutes =_________ minutes of cell cycle spent in stage.
Exercise 3B.1 – Hypothesis
Using beads it will be possible to show the stages of meiosis I and meiosis II.
Materials
The materials used in this exercise were chromosome simulation kits containing four strands of beads. Two strands will be one color and the other two strands should be another color.
Methods
To show the process of interphase place one strand of each color near the center of your work area. Next, simulate DNA replication by bringing the magnetic centromere region of one strand in contact with the centromere region of the other of the same color. Do the same with its homolog. Next, to show crossing over in prophase I pop the beads apart on one chromatid at the fifth bead. Do the same with the other chromatid. Then reconnect the beads to those of the other color. Proceed through prophase I of meiosis and note how crossing over results in recombination of genetic information. Then to show metaphase I place the chromosomes near the middle of the cell. During anaphase I, the homologous chromosomes separate and are “pulled” to opposite ends of the cell. Next, to show telophase I place each chromosome at opposite sides of the cell.
In prophase II of meiosis II replicated centrioles separate and move to opposite sides of the chromosome groups. Next, to show metaphase II arrange the chromosomes so they are centered in the middle of each daughter cell. Then, separate the chromatids of the chromosomes and pull the daughter chromosomes toward the opposite sides of the daughter cell in order to show anaphase II. Finally in order to show telophase II, place the chromosomes at opposite sides of the dividing cell.
Exercise 3B.2 – Hypothesis
There will be more asci that maintain a 4:4 relationship of not crossing over than asci that do cross over.
Materials
The materials used in this exercise were a prepared slide of Sordaria fimicola and a light microscope.
Methods
Begin by obtaining a prepared slide that contain asci of Sordaria fimicola. Then, using the 10 X objective, view the slide and locate a group of hybrid asci. Make sure to count at least 50 hybrid asci and enter your data in table 3.3.
Results
Exercise 3A.1
Exercise 3A.2
Table 3.1
|
Number of Cells |
||||||
| Field 1 | Field 2 | Field 3 | Total | |||
| Interphase | 42 | 36 | 47 | 125 | 61.27 | 14 hours 42 min |
| Prophase | 10 | 14 | 18 | 32 | 20.10 | 4 hours 49 min |
| Metaphase | 6 | 5 | 4 | 15 | 7.35 | 1 hour 45 min |
| Anaphase | 2 | 3 | 2 | 7 | 3.43 | 49 min |
| Telophase | 7 | 5 | 4 | 16 | 7.84 | 1 hour 52 min |
Exercise 3B.2
Table 3.3
| Number of 4:4 | Number of Asci showing crossover | Total Asci | % Asci showing crossover divided by 2 | Gene to centromere distance (map units) |
| 60 | 45 | 105 | 21.4 % | 21.4 map units |
Questions:
Exercise 3A.1
1.Why is it more accurate to call mitosis “nuclear replication” than “cellular division”?
In mitosis two new nuclei are being formed. Also cytokinesis is actually a part of mitosis.
2. Explain why the whitefish blastula and onion root tip are selected for a study of mitosis?
A blastula is a hollow ball of cells that forms when an egg divides quickly; a large amount of mitosis is taking place here. The onion root tip is the place where growth occurs in the onion so a large amount of mitosis is taking place here.
Exercise 3A.1
1. If your observations had not been restricted to the area of the root tip that is actively dividing, how would your results have been different?
The tips are located in the meristem. Cells that are not in the meristem do not divide as quickly but they are elongating and differentiating. None of the phases would have been visible.
2. Based on the data in table 3.1 what can you infer about the relative length of time an onion root-tip cell spends in each stage of cell division?
Prophase is the longest stage and telophase is the shortest.
Exercise 3B.1
1. List three major differences between the events of mitosis and meiosis?
Mitosis has one nuclear division and meiosis has two nuclear divisions. Mitosis makes two identical daughter cells. Meiosis makes four daughter cells that half the number of chromosomes that their parent cells had. Crossing over and the exchange of genes occurs in meiosis but not in mitosis.
2.Compare mitosis and meiosis with respect to the following:
| Mitosis | Meiosis | |
| Chromosome number of parent cells | 2n | 2n |
| Number of DNA replications | 1 | 1 |
| Number of divisions | 1 | 2 |
| Number of daughter cells produced | 2 | 4 |
| Chromosome number of daughter cells | 2n | n |
| Purpose | Growth and repair | Gamete and spore production |
3. How are meiosis I and meiosis II different?
Meiosis I starts with a tetrad and separates the homologs. In meiosis the strands separate into 4.
4. How do oogenesis and spermatogenesis differ?
In oogenesis an egg is formed and three cells called polar bodies die. In spermatogenesis sperm are formed.
5. Why is meiosis important for sexual reproduction?
In meiosis the chromosome number is reduced by half. When fertlization occurs chromosome number is restored. Gene exchange causes variation.
6.Using your data in table 3.3 determine the distance between the gene for spore color and the centromere. Record your results in table 3.3.
Table 3.3
| Number of 4:4 | Number of Asci showing crossover | Total Asci | % Asci showing crossover divided by 2 | Gene to centromere distance (map units) |
| 60 | 45 | 105 | 21.4 % | 21.4 map units |
7. Draw a pair of chromosomes in MI and MII and show how you would get a 2:4:2 arrangement of ascospres by crossing over.
Error Analysis
In exercise 3A.2 inaccurate results were received. There should have been fewer cells in telophase than any of the other phases and cells should have spent less time in telophase than in any of the other phases. The results received are inaccurate because the number of cells that were in telophase were improperly counted. We received results that more cells were in telophase and spent more time in telophase than anaphase. In exercise 3B.2 improperly identifying some of the asci as crossover or non-crossover might have caused the results that were received to be inaccurate.
Conclusions:
From these experiments one can conclude that it is possible to look at mitotic stages of onion root tip cells and whitefish blastula through a microscope and draw them. Also, from these experiments one can conclude that most of the cell cycle in an onion root tip is spent in interphase. Prophase is after interphase in time spent in each cycle. Metaphase is after prophase. Anaphase is after metaphase. The least amount of time is spent in telophase. Also, a person can simulate the chromosomes in meiosis I and meiosis II using a chromosome simulation kit. Finally, one can conclude form the results of the experiments that more asci do not cross over in Sordaria fimicola than the number of asci that do cross over.