
Category: My Classroom Material
Vertebrate Projects
 |
Vertebrate Project |  |
Choose one of the following activities to turn in at the conclusion of the unit study of vertebrates.
- Watch and record a 60 minute program on a vertebrate group. Write a summary of the program, create a worksheet to be answered from the video, and supply a key for the worksheet answers.
- Create a portfolio of pictures and descriptions of the most dangerous sharks in the world. Write a report on sharks to include with your portfolio and tell what can be done to avoid shark attack and what should be done if an attack occurs.
- Research the migration pattern of one of the following — gray whale, caribou, Arctic wolf, or a species of bats. Include a map of the animal’s migration route, season when the migration occurs, and a description of the animal’s feeding and mating habits.
- Construct, on poster board, a phylogenetic tree for a vertebrate group (fish, amphibian, reptile, bird, or mammal). Include pictures of the organisms on your tree and write a short paper describe the evolution of this group.
- Construct a scrapbook of 20 pictures of one mammal order. Pictures may not be Xeroxed or computer generated! Include the name and a brief description with each picture.
- Make a three-dimensional collage of one group of marine vertebrates. The shape of the collage must illustrate something from the marine environment or a marine organism. Include a brief description of the marine environment and organisms you chose for your collage.
- Make a photographic album of pictures of birds. (Pictures will not be returned!) Include the common and scientific name & a brief description of each bird.
- Read the book, Silent Spring, by Rachel Carson and write a book report.
- Build a model of the digestive tract of an herbivore such as a cow. Be sure to include the dentition and an explanation of how this animal’s digestive tract is adapted to its diet.
- Construct a display of the hearts of these 3 vertebrate groups — fish, amphibian, bird or mammal. Use modeling clay to make cross-sections of the hearts showing chambers and valves. Identify all parts of the hearts on your display.
01_13bPositiveFeedback_A
Unsegmented Worm
Unsegmented Worms

All Materials © Cmassengale
Phylum Platyhelminthes
Characteristics
- Called flatworms because bodies are flattened dorso-ventrally

- Acoelomate – solid bodies without a lined body cavity
- Have 3 body layers — outer ectoderm, middle mesoderm, & inner endoderm
- Bilaterally symmetrical
- Show cephalization (concentration of sensory organs at anterior or head end)
- Body cells exchange oxygen & carbon dioxide directly with environment by diffusion
- Single opening into gastrovascular cavity; two-way digestive tract
- Some are parasites & others are free-living
- Parasitic worms have thick cell layer called tegument covered with a nonliving cuticle covering their bodies as protection inside hosts
- Includes 3 classes — Turbellaria (planarians), Trematoda (parasitic flukes), & Cestoda (parasitic tapeworms
Class Turbellaria
- Most are marine but includes freshwater planarian (Dugesia)
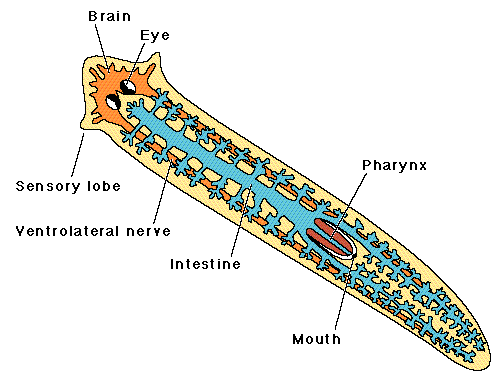
Planarians
- Spade-shaped at the anterior end & have two, light-sensitive eyespots
- Can sense light, touch, taste, & small
- Have 2 clusters of nerve cells or ganglia to form a simple brain
- Nervous system composed of a nerve net
- Capable of simple learning
- Move by tiny hairs or cilia over a mucus layer that they secrete
- Feed by scavenging or protozoans
- Have a single opening or mouth located at the end of a muscular tube called the pharynx which can be extended when feeding
- Flame cells help remove wastes to excretory pores

- Hermaphrodites that cross-fertilize eggs that are then deposited into a capsule until hatching in 2-3 weeks
- Reproduce asexually by fragmentation

Class Trematoda
- Includes parasitic flukes
- About 1 cm long & oval shaped

- Require a host to live
- Have both oral & ventral suckers to cling to host & suck blood, cells, & body fluids
- Oral sucker around mouth at anterior end sucks blood
- May be endoparasites (live inside a host) or ectoparasites (live on the outside of host
- Covered in tough, unciliated tegument
- Nervous & excretory systems like turbellarians
- Hermaphrodites
- Have a long, coiled uterus that stores & releases 10,000+ eggs
- Eggs released through genital pore & develop into larva
- Show complex life cycles
- Life cycle of sheep liver fluke:
* Adult liver flukes live in sheep liver & gall bladder where they mate & form eggs
* Eggs enter intestines, pass out with feces, & hatch in water
* Larva enter snails, asexually multiply, then leave snail & form cysts
* Cysts (dormant larva with hard, protective covering) clings to grass
* Sheep ingest cysts when they eat grass
* Cysts hatch in digestive tract & bore through intestines into bloodstream
* Mature & reproduce in the liver

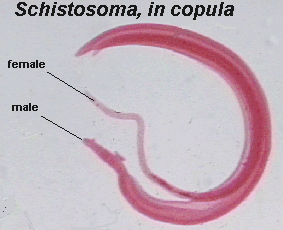
- Schistosomiasis (disease caused by parasitic blood flukes) infects people in Asia, Africa, & South America causing intestinal bleeding & tissue decay that can result in death
Class Cestoda
- Includes tapeworms
- Adapted for parasitic life
- Tough outer tegument prevents being digested by host
- Anterior end called scolex contains hooks & suckers for attachment to intestine of host

- Long, ribbon-like bodies up to 12 m in length
- Nervous system extends length of body but lacks sense organs
- Lacks mouth & digestive tract but absorbs digested nutrients from host
- Grows by making body segments called proglottids
- Each proglottid produces eggs & sperm that cross-fertilize with other segments & also self-fertilize (hermaphrodites)
- Oldest, mature proglottids containing eggs at posterior end break off & pass out with feces
- Life cycle of beef tapeworm:
* Cattle eat grass with proglottids containing fertilized eggs
* Eggs hatch into larva & bore through cow’s intestine into bloodstream
* Larva burrow into cow’s muscle & form cysts
* Humans eat beef (muscle) & cysts travels to intestines
* Cyst breaks open & adult beef tapeworm forms

BEEF TAPEWORM LIFE CYCLE
Phylum Nematoda
Characteristics
- Called roundworms
- Includes Ascaris, hookworms, Trichinella, & pinworms
- Pseudocoelomates have fluid-filled body cavity partially lined with mesoderm
- Pseudocoelom contains the body organs & provides hydrostatic skeletal support for muscles
- Have long slender bodies that taper at both ends

- Covered with flexible cuticle
- Digestive tract with anterior mouth & posterior anus; called one-way digestive tract
- Separate sexes in most species
- Most are free living
- Some are parasites on plants & animals
- Ascaris is a parasitic roundworm living in the intestines of pigs, horses, & humans
- Ascaris life cycle:
* Enter body in contaminated food or water & hatch in intestines
* Larva bore into bloodstream & carried to lungs & throat
* Larva coughed up, swallowed, & return to intestines to mature & mate
* Block the intestine causing death

- Hookworm eggs hatch in moist soil & larva bore through bare feet of new host
- Trichinella are human parasites caused by eating undercooked pork containing the cysts
* Cause disease called trichinosis
* Cysts cause muscle pain & stiffness

CYSTS IN CONTAMINATED PORK
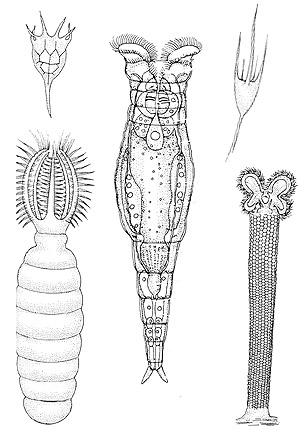
Phylum Rotifera
Characteristics
- Known as rotifers or wheel animals
- Transparent, free-swimming microscopic animal
- Freshwater & marine
- Have a ring of cilia around mouth that rotates like a wheel to bring in food
- Feed on unicellular algae, bacteria, & protozoa
- Have a muscular organ called the mastax behind the pharynx to chop food
- Nervous system composed of anterior ganglia & 2 long nerve cords
- Show cephalization (head end)
- Have 2 anterior, light-sensitive eyespots
Unsegmented Worms Study Guide B1
Unsegmented Worm Study Guide

- Describe the digestive tract of planarians
- How are tapeworms able to get their food
- What is the life style of most flatworms
- What are the characteristics of rotifers
- What are the general characteristics of all flatworms
- Why do flatworms not need circulatory & respiratory systems
- What causes schistosomiasis
- To what kingdom & phylum do flatworms belong
- Describe a pseudocoelom & give examples of worms that have this characteristic
- Explain the life cycle of Ascaris
- How do rotifers eliminate wastes
- What is regeneration & give an example of an unsegmented worm that uses this process
- What is the cuticle and what is its function
- What are proglottids & what is their function
- If a worm has a one-way digestive system, what must be true about the organism
- Why are rotifers called “wheel animals”