Taxonomy PPT Questions

Taxonomy
ppt Questions

Classification

1. How many known species are there?

2. What percent of all organisms that have ever lived is this?

3. Are all organisms on Earth today identified?

4. Define classification.


5. What is another term for classification?

6. What do you call scientists that study classification?

7. Classifying organisms makes naming organisms more _____________ and _____________.

8. Classifying prevents ____________ or inaccurate naming.

9. Give two examples of misnomers and explain why they aren’t correct.


10. What language is used for scientific naming?

11. Sometimes, scientific names may be ___________ instead of Latin.

12. Why don’t scientists around the world just use more simple, common names for organisms?


13.What language is universally used by scientists for naming?

14. Who was the first taxonomist and what two groups did he place organism in?


15. How did Aristotle subdivide his two groups?


16. Who was first to use Latin for scientific naming?

17. What was the problem with Ray’s names?

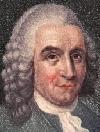
18. What 18th century taxonomist developed the naming system still used today?

19. How did Linnaeus group his organisms?

20. Who is the “father of taxonomy”?

Binomial Nomenclature

21. What is Linnaeus’s naming system called?

22. Explain binomial nomenclature.


23. Besides Latin, what other language is sometimes used for scientific names?

24. How do scientific names appear in print?

25. What must be done to a scientific name when you are writing it?

26. Give an example of a common and scientific name for an animal.


27. Where can you find the rules for naming organisms?

28. All scientific names must be approved by ________________ ___________ ______________.

29. Why do naming congresses have to approve names?


Taxonomic Groups

30. What is a taxon?


31. What is plural for taxon?

32.There is a ______________ of groups that goes from the broadest grouping to the most _____________ grouping.

33. Name the 8 taxon in order from broadest to most specific.


34. What is the NEWEST and BROADEST taxon?

35. Instead of the taxon phylum, what other taxon is used for plants at this level?

36. What is the most specific taxon?

37. Write the sentence used to help remember the 8 most important taxonomic levels.


38. Complete the following taxonomic table:


Classification for Humans
Taxonomic Level Taxon
Domain
Kingdom
Phylum
Class
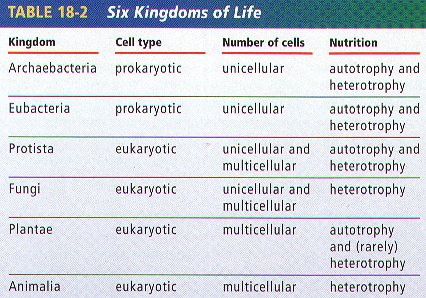
Order
Family
Genus
Species


Domains of Organisms

39. How many domains are there?

40. Name the 3 Domains.


41. What are the main characteristics of Archaea and Eubacteria?


42. What are the main characteristics of the Domain Eukarya?


43. What Domain of organisms probably evolved first?

44. Where do Archaea live? Give some examples.


45.Name an Archaean.

46. Where are eubacteria found?


47. Some bacteria cause ______________ but many act as decomposers & are important to the ______________.

48. Some members of eubacteria live in the __________ of animals.

Kingdoms

49. The Domain Eukarya is divided into how many kingdoms?

50. List the 4 kingdoms of Eukarya and tell what organisms are in each group.


51. Which 2 kingdoms contain all multicellular members?

52. List the main characteristics of the Kingdom Protista.


53. Microscopic organisms found in pond water are most likely in the kingdom _______________.

54. All members of the Kingdom Fungi are _____________ except for unicellular ____________.

55. What type of heterotrophic organism are fungi?

56. Explain what it means to be an absorptive heterotrophic.


57. The cell walls of fungi are made of ______________.

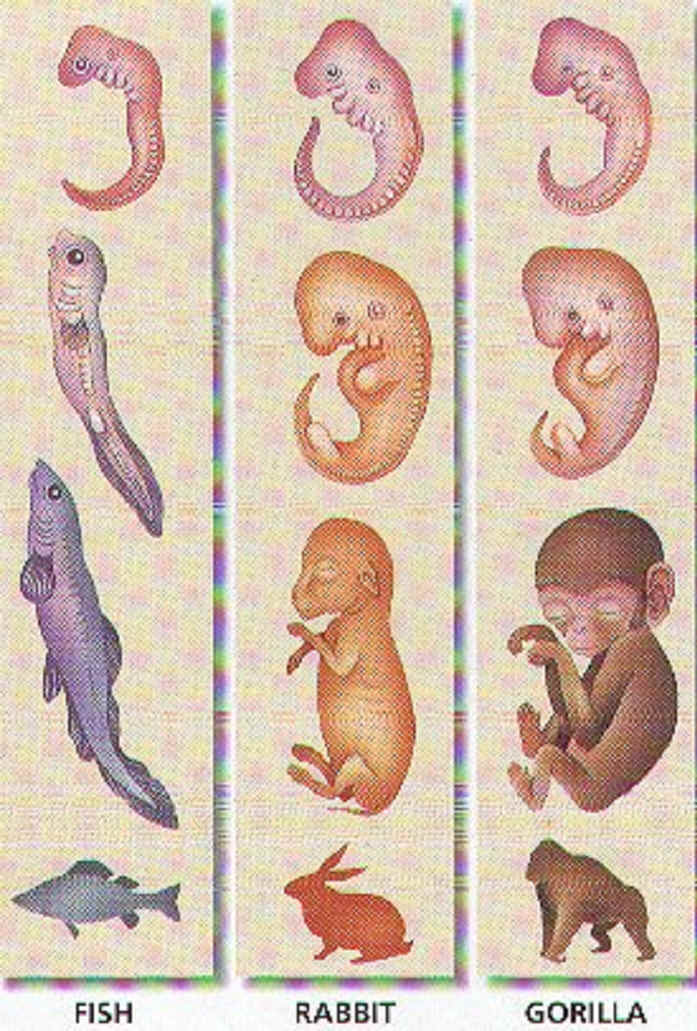
58. Members of the kingdom Plantae are all ________________ and _____________.

59. What do plants use as their energy to make food?

60. Name the food making process of plants.

61. Plant cell walls are made of _______________.

62. Members of the Kingdom Animalia contain all of the multicellular _____________ on Earth.

63. Animals are ______________ heterotrophs that feed on __________ or other __________.

64. Define ingestive heterotroph.


65. Complete the following table for characteristics of each kingdom:

Kingdom Organization Type of Nutrition Examples
Protista
Fungi
Plantae
Animalia

66. A Genera may contain a number of different ___________.

67. What Genera is an exception to this?

68. Which Kingdom has the largest number of different kinds of organisms?

69. What two groups are in the plant kingdom?


Basis for Modern Taxonomy

70. List three examples of things used as a basis for modern taxonomy.

     a.

     b.

     c.

71. What are homologous structures?


72. What is an embryo?

73. At the molecular level, similarities in ___________, __________, or the __________ __________ sequence of proteins can be a basis for grouping organisms together.

74. Give an example of homologous structures show similarities among organisms in the same taxon.


75. Name 5 organisms that have similar embryonic development. To what taxon do these organisms belong?


76. What is a cladogram?


77. Using the following cladogram, name the organisms that share 4 of the 5 characteristics.

78. What characteristic(s) do the grouper and lamprey share?


79. What characteristic is found in all the animals EXCEPT the lancelet?

80. What is a dichotomous key?


81. When using a dichotomous key, you should make sure you ___________ both characteristics and either ____________ the organism OR go to ____________ set of characteristics.


82. Use the following dichotomous key to identify the picture of each organism.


1a Tentacles present – Go to 2
1b Tentacles absent – Go to 6
2a Eight Tentacles – Octopus
2b More than 8 tentacles – 3
3a Tentacles hang down – go to 4
3b Tentacles upright–Sea Anemone
4a Balloon-shaped body–Jellyfish
4b Body NOT balloon-shaped – 5


Teddy Graham Natural Selection Lab

Natural Selection in Teddy Grahams

Introduction

You are a bear-eating monster. There are two kinds of bears that you like to eat: happy bears and sad bears. You can tell the difference between them by the way they hold their hands. Happy bears hold their hands high in the air, and sad bears hold their hands down low. Happy bears taste sweet and are easy to catch. Sad bears taste bitter, are devious and hard to catch. Because of this you only eat happy bears. The happy trait in bears is caused by the expression of a recessive allele. The homozygous recessive condition is being happy. The sad trait is caused by a dominant allele. New bears are born every year (when they are hibernating in their den, the cardboard box), and the birth rate is one new bear for every old bear left from last year.

Materials:

Teddy Bear Grahams, lab worksheet, pencil

Procedure:

1. Obtain a population of 10 bears and record he number of happy and sad bears and the total population number. Using the equation for Hardy-Weinberg equilibrium, calculate the frequencies of both the dominant and recessive alleles and the genotypes that are represented in the population. Example: If 5 of the 10 bears are happy, then 10 out of 20 alleles would be happy alleles. Therefore the q2 number would be 0.5. You must then determine the q number by taking the square of 0.5.

2. Now, go hunting! Eat 3 happy bears. (If you do not have 3 happy bears then eat the difference in sad bears.)

3. Once you have consumed the bears obtain a new generation from your den (the box). You should only remove seven additional bears from the den for a total of 14 bears.

4. Repeat the procedures again. Be sure to record the number of each type of bear and the total population.

Table:


Generations P2 (sad) 2pq (sad) q2 (happy) P q
1. Initial
2.
3.
4.


Questions:

1. Describe what is happening to the genotype and allele frequencies in the population of Teddy Grahams?


2. What would you expect to happen if you continued the selection process for additional generations?


3. How would the frequencies change if you were to now select for the sad bears?


4. Why doesn’t the recessive allele disappear from the population? How is it protected?


TRAINING – HOW TO USE SMART BOAR

TRAINING – HOW TO USE SMART BOARDS
http://www.teacheronlinetraining.com/complimentary/ – Online training(60 minutes)
SMART BOARD FORUMS
Learn and share with other educators.
http://smartboardrevolution.ning.com/ – All SMART Board educators, unite! Let’s share ideas, tips, and lesson files and collaborate to maximize our students’ learning.
http://projects.minot.k12.nd.us/groups/smarttechnologies/ – SMART board Technology site: area to share and learn.
LESSONS AND TEMPLATES
http://www1.center.k12.mo.us/edtech/SB/templates.htm – Templates available for K-12 classes. http://eduscapes.com/sessions/smartboard/ – all grades
http://www1.center.k12.mo.us/edtech/resources/SBsites.htm – Interactive sites to use with your SMART board.
GAMES AND QUIZZES
Class Tools – Use this site to create your own interactive games using your curriculum.
http://tinyurl.com/27sbntd – Classroom games and quizzes, and other teacher resources
http://www.jigsawdoku.com/ – Jig Saw Doku http://tinyurl.com/25km2uo – SMART Boards and the Fifty Nifty States and Capitals
SCIENCE
http://www.getbodysmart.com/index.htm – AN ONLINE TEXTBOOK ABOUT HUMAN ANATOMY AND PHYSIOLOGY
SOCIAL STUDIES
http://tinyurl.com/25km2uo – SMART Boards and the Fifty Nifty States and Capitals

Understanding Graphs

Understanding Graphs

Graph 1: Rabbits Over Time

a. The graph shows a __________ growth curve.
b. The carrying capacity for rabbits is ______
c. During which month were the rabbits in exponential growth?


Graph 2: Average Toe Length

a. In 1800, about how many people surveyed had a 3 cm toe? _______
How many in 2000? _______
b. The data shows the ____________ selection has occurred?
c. In 2000, what is the average toe length? ______ What is the average toe length in 1800 _______?


Graph 3: Mexico and US

a. In Mexico, what percentage of the population is between 0-4 years of age? _______ In the US? ______
b. Which population is growing the fastest? ________
c. Which age group has the smallest number in both countries? _____


Chart 4: Trapping Geese

In order to estimate the population of geese in Northern Wisconsin, ecologists marked 10 geese and then released them back into the population. Over a 6 year period, geese were trapped and their numbers recorded.

a. Use the formula to calculate the estimated number of geese in the area studied? _____________
b. This technique is called ____________ & ______________.
c. Supposing more of the geese found in the trap had the mark, would the estimated number of geese in the area be greater or lesser? _____


Year Geese Trapped Number with Mark
1980 10 1
1981 15 1
1982 12 1
1983 8 0
1984 5 2
1985 10 1

Chart 5: Mushroom Plots

Another ecologist uses a different method to estimate the number of mushrooms in a forest. She plots a 10×10 area and randomly chooses 5 spots, where she counts the number of mushrooms in the plots and records them on the grid.

a. Calculate the number of mushrooms in the forest based on the grid data: _________________
b. This technique is called _______________


Chart 6: Snakes & Mice

The data shows populations of snake and mice found in an experimental field.

a. During which year was the mouse population at zero population growth? ______
b. What is the carrying capacity for snakes ? ______
c. What is the carrying capacity for mice? _____
d. What is the rate of growth (r) for mice during 1970? _____ During 1980? ______

Year Snakes Mice born Mice died
1960 2 1000 200
1970 10 800 300
1980 30 400 500
1990 15 600 550
2000 14 620 600
2001 15 640 580

Click here for printable copy (landscape) 

BACK

Square Roots


AP Biology Grading

Some major test grades will be determined by taking the square root of the student’s raw score (number of points correct). For example, if there are 50 questions on a test and each question counts 2 points each, a student who answers 35 questions correctly (70% of the total points possible or 70 points) will receive a score of √ 70 or 84%.

Table of Squares and Square Roots

Use this table to find the squares and square roots of numbers from 1 to 100.

You can also use this table to estimate the square roots of larger numbers.

  • For instance, if you want to find the square root of 2000, look in the middle column until you find the number that is closest to 2000. The number in the middle column that is closest to 2000 is 2,025.
  • Now look in at the number to the left of 2,025 to find its square root. The square root of 2,025 is 45.
  • Therefore, the approximate square root of 2,000 is 45.

To get a more exact number, you will have to use a calculator (44.721 is the more exact square root of 2,000).


Number Square Square root
1 1 1.000
2 4 1.414
3 9 1.732
4 16 2.000
5 25 2.236
6 36 2.449
7 49 2.646
8 64 2.828
9 81 3.000
10 100 3.162
11 121 3.317
12 144 3.464
13 169 3.606
14 196 3.742
15 225 3.873
16 256 4.000
17 289 4.123
18 324 4.243
19 361 4.359
20 400 4.472
21 441 4.583
22 484 4.690
23 529 4.796
24 576 4.899
25 625 5.000
26 676 5.099
27 729 5.196
28 784 5.292
29 841 5.385
30 900 5.477
31 961 5.568
32 1,024 5.657
33 1,089 5.745
34 1,156 5.831
35 1,225 5.916
36 1,296 6.000
37 1,369 6.083
38 1,444 6.164
39 1,521 6.245
40 1,600 6.325
41 1,681 6.403
42 1,764 6.481
43 1,849 6.557
44 1,936 6.633
45 2,025 6.708
46 2,116 6.782
47 2,209 6.856
48 2,304 6.928
49 2,401 7.000
50 2,500 7.071
51 2,601 7.141
52 2,704 7.211
53 2,809 7.280
54 2,916 7.348
55 3,025 7.416
56 3,136 7.483
57 3,249 7.550
58 3,364 7.616
59 3,481 7.681
60 3,600 7.746
61 3,721 7.810
62 3,844 7.874
63 3,969 7.937
64 4,096 8.000
65 4,225 8.062
66 4,356 8.124
67 4,489 8.185
68 4,624 8.246
69 4,761 8.307
70 4,900 8.367
71 5,041 8.426
72 5,184 8.485
73 5,329 8.544
74 5,476 8.602
75 5,625 8.660
76 5,776 8.718
77 5,929 8.775
78 6,084 8.832
79 6,241 8.888
80 6,400 8.944
81 6,561 9.000
82 6,724 9.055
83 6,889 9.110
84 7,056 9.165
85 7,225 9.220
86 7,396 9.274
87 7,569 9.327
88 7,744 9.381
89 7,921 9.434
90 8,100 9.487
91 8,281 9.539
92 8,464 9.592
93 8,649 9.644
94 8,836 9.695
95 9,025 9.747
96 9,216 9.798
97 9,409 9.849
98 9,604 9.899
99 9,801 9.950
100 10,000 10.000


NOTE: Square roots in this table are rounded to the nearest thousandth.