| Biology Club Photos | |
| The photos on this site change during the year | |
| Click here for Photo Archive | |
| Home | |
| Biology Club Photos | |
| The photos on this site change during the year | |
| Click here for Photo Archive | |
| Home | |
| Starfish Dissection |  |
Introduction:
Echinoderms are radially symmetrical animals that are only found in the sea (there are none on land or in fresh water). Echinoderms mean “spiny skin” in Greek. Many, but not all, echinoderms have spiny skin. There are over 6,000 species. Echinoderms usually have five appendages (arms or rays), but there are some exceptions.
Radial symmetry means that the body is a hub, like a bicycle wheel, and tentacles are spokes coming out of it (think of a starfish). As larvae, echinoderms are bilaterally symmetrical. As they mature, they become radially symmetrical. Most adult echinoderms live on the bottom of the ocean floor. Many echinoderms have suckers on the ends of their feet that are used to capture and hold prey, and to hold onto rocks in a swift current.
Sea Stars
 Sea stars (group name Stelleroidea) are sometimes called starfish, though they are not real fish (they lack both vertebrae and fins). There are two sub-types of sea stars:
The differences between the two sub-types lies in how the arms connect to the central disk. Ophiuroids have arms that do not connect with each other. There is a distinct boundary between arm and central disk. Asteroids have arms that are connected to each other. Also, it is harder to tell with asteroids where the central disk ends and the arms begin. The sea star’s top surface (or skin) looks spiny if you examine it. If you look very closely you will notice that there are different types of growths on the surface. Some bumps are used to absorb oxygen, they are called dermal branchiae. Pedicellaria are pincher-like organs used to clean the surface of the skin. Barnacle larvae could land on a sea star and start growing if it were not for these organs.
How Do Sea Stars Move?
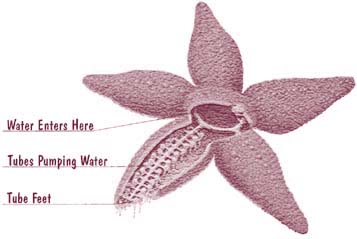
 Each sea star had hundreds of tiny feet on the bottom of each ray. These are tube feet, or podia. These tiny feet can be filled with sea water. The vascular system of the sea star is also filled with sea water. By moving water from the vascular system into the tiny feet, the sea star can make a foot move by expanding it. This is how sea stars move around. Muscles within the feet are used to retract them. Each ray of a sea star has a light sensitive organ called an eyespot. Though it can not see nearly as well as we do, sea stars can detect light and its general direction. They have some idea of where they are going.
Materials:
Preserved starfish, dissecting pan, scissors, scalpel, forceps, T-pins, pencil, lab apron, safety glasses
Procedure (Aboral Surface):
Figure 1 -Aboral Surface

Procedure (Oral Surface):
Figure 2 – Oral Surface

Procedure (Internal anatomy):
Figure 3 – Cuts in Arm
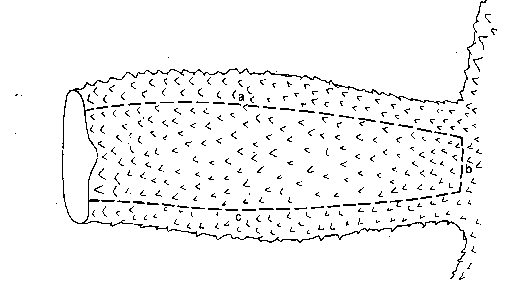
Figure 4 – Starfish Digestive & Reproductive Systems
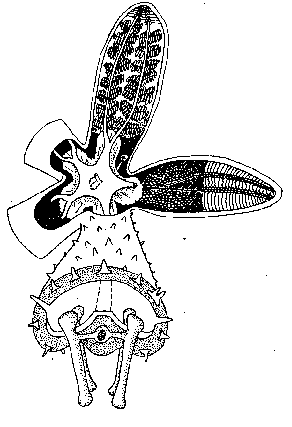
Figure 5 – Water Vascular System

1. What type of symmetry did your starfish have?
2. What is the upper surface of the starfish called?
3. What is the lower surface of the starfish called?
4. On which surface are these parts of a starfish visible:
a. Mouth –
b. Madreporite –
c. Suckers –
d. Oral spines –
e. Eyespots –
d. Ambulcaral groove –
5. In words, trace the path water takes through the water vascular system.
6. What part of the tube foot creates suction to open clams whenever the starfish feeds?
7. Why do the gonads sometimes appear larger?
8. What type of skeleton, endoskeleton or exoskeleton, does the starfish have?
9. What bony plates make up its skeleton?
10. What is the function of the pyloric caeca?
11. where is the stomach of a starfish located? What can the starfish do with its stomach when feeding on clams & oysters?
12. Name the kingdom, phylum, and class for the starfish you dissected.
Simple Seedless Nonvascular & Vascular Plants
PowerPoint Worksheet
Seedless Nonvascular plants
1. Name the 3 divisions of seedless vascular plants and a member of each division.
a.
b.
c.
Division Bryophyta
2. What is the common name for mosses, liverworts, and hornworts?
3. Bryophytes lack what type of tissue?
4. Name the 2 vascular tissues lacking in bryophytes and tell their function.
5. What is the 2 stage life cycle of plants called?
6. Name the 2 life cycle stages.
7. which stage is DOMINANT in bryophytes (mosses, liverworts, & hornworts)?
8. How do bryophytes reproduce?
9. Which stage of the moss looks like a lush green carpet?
10. Name the division for moss.
11. Why are moss small plants?
12. Do moss have TRUE roots, stems, or leaves?
13. In what type of area do moss grow? Give several examples.
14.Moss gametophytes must grow close together in moist areas. Give 2 reasons why this is so.
a.
b.
15. What covers the outside of a moss plant to prevent water loss?
16. What anchors moss plants?
17. Can rhizoids absorb water like true roots?
18. Where does the sporophyte generation occur on moss plants?
19. What is at the top of the sporophyte?
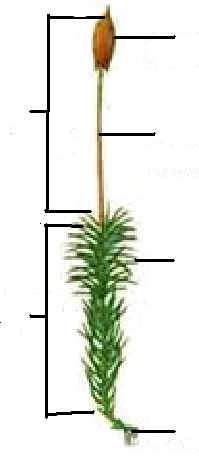
20. Label the following moss plant.
21. ___________ moss is used by florist. What characteristic makes it useful?
22. Because moss will grow on bare ground, it is called a _________ plant.
23. How is peat moss used?
24. Give 4 other uses for moss.
25. Moss are capable of asexual reproduction. Name and describe 2 types of this vegetative reproduction.
a.
b.
26. What are gemmae?
27. How are gemmae separate from the parent plant & dispersed?
28. Which stage of the moss is haploid and which is diploid?
29. The gametophyte generation produces what 2 cells?
30. Why do these cells have half the chromosome number?
31. ____________ have a ________ set of chromosomes and reproduce ___________.
32. the sporophyte grows attached to the top of the ______________.
33. Since sporophytes lack chlorophyll, what cellular process are they incapable of doing?
34. How does the sporophyte get its food?
35. What is the setae on a moss plant?
36. How are the moss gametes protected?
37. Name the female gametangia & tell what it produces.
38. Eggs of moss are _____________ & ___________.
39. Label the female gametangia.
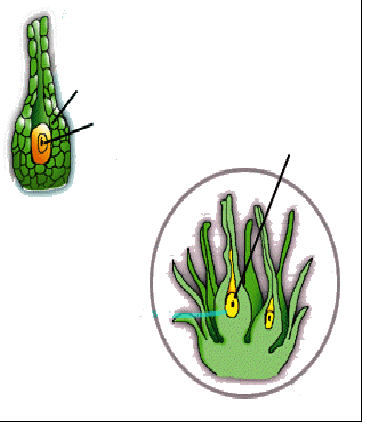
40. Name the male gametangia & tell what it produces.
41.How does the sperm cell know the direction in which to swim to the egg?
42. Label the male gametangia.
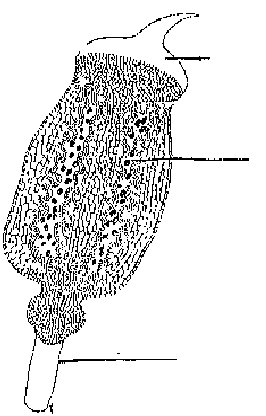
43. The moss ___________ or fertilized egg develops into the ____________.
44. Spores of the sporophyte capsule germinate into young plants called ______________.
45. Protonema develop into the _____________ stage
46. Label the protonema & developing gametophyte in this picture.
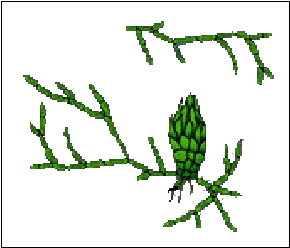
47. Label the life cycle of the moss.
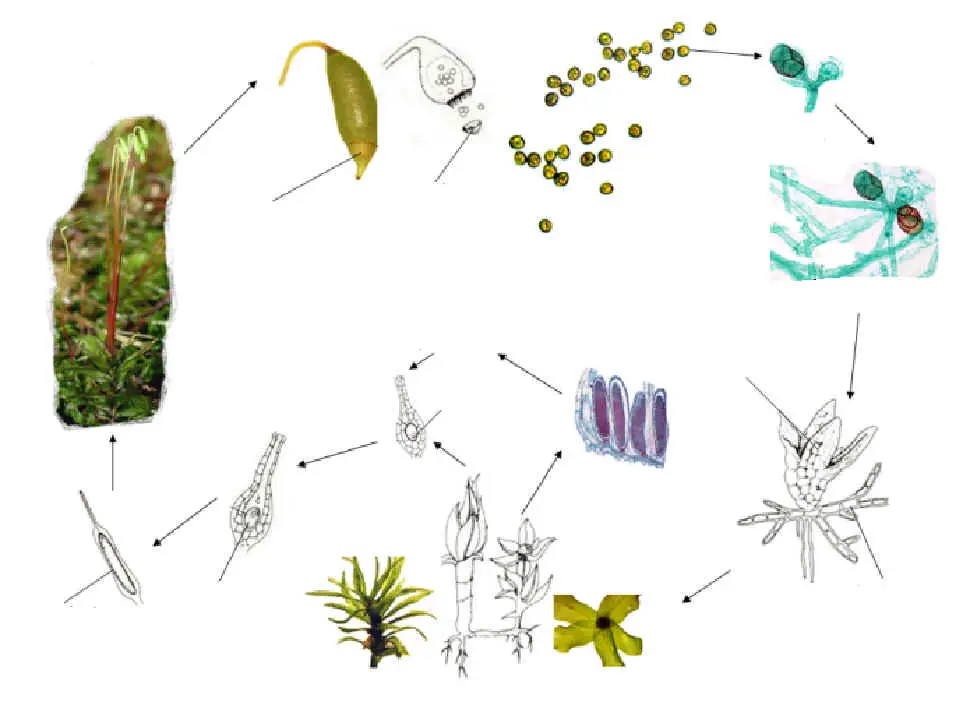
Division Hepatophyta
48. ___________ are nonvascular, _________ producing bryophytes.
49. What stage is dominant in liverwort’s life cycle?
50. Describe the liverwort gametophyte.
51.Liverworts are found growing where?
52. Liverworts need lots of water for ____________.
53. How do liverworts reproduce asexually?
54. How do liverworts reproduce sexually?
Division Anthocerophyta
55._____________ are small, nonvascular ____________ with a dominant, leafy ____________ like liverworts.
56. Where are the antheridia & archegonia in hornworts?
57. Zygotes develop into ______________ sporophytes.
58. Is the horn-shaped sporophyte capable of photosynthesis?
59. Is the horn-shaped sporophyte attached to or separate from the gametophyte?
60. Label the parts of the hornwort.
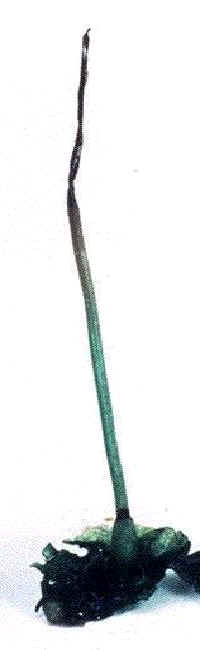
Seedless Vascular Plants
61.Label these structures on the back of this fern.
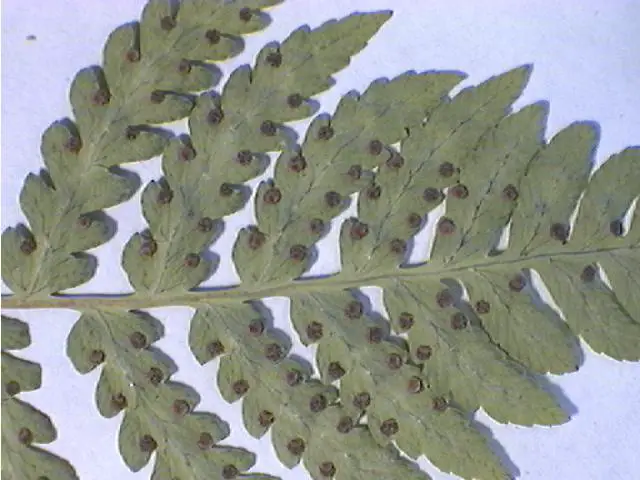
62. Name and give an example of a plant in the 4 divisions of seedless vascular plants.
a.
b.
c.
d.
63. Name the vascular tissues.
64. Do seedless vascular plants go through alternation of generations?
65. Which stage is dominant?
66. How do they reproduce?
Division Psilophyta
67.Describe whisk ferns.
68. Do they have true roots, stems, or leaves?
69.How many extant genera are there?
70. Name the root like structures of whisk ferns and tell whether they can or can’t absorb water.
71. How do whisk ferns reproduce asexually?
72. How do whisk ferns reproduce sexually?
73. Make and label a sketch of an aerial branch of whisk with sporangia.
74. What is the purpose of sporangia?
Division Lycophyta
75. The division Lycophyta contains the ______________ living vascular plants.
76. Club moss are commonly called ______________ ____________. Explain why this is true.
77.Club moss have ________ growing root like ___________.
78. Describe the habitat needed by club moss.
79. Describe the leaves of club moss.
80. Are these TRUE leaves? Explain why.
81. What is found in the axils of the leaves & what is their purpose?
82. What are strobili?
83. Some club moss are homosporous while others are heterosporous. Explain what each of these terms means.
a. homosporous-
b. heteroporous-
84. Give an example of a homosporous club moss.
85. Lycopodium is used in fireworks. Explain the reason for this.
86. What do the spores of Lycopodium look like?
87.What is the purpose of each of these structures.
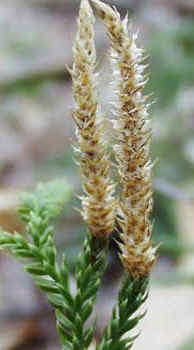
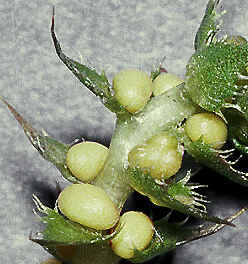
88. Give 3 other uses for club mosses.
a.
b.
c.
Division Sphenophyta
89. How many extant species of horsetails are there?
90. Name the living genera of horsetails.
91. What is another name for horsetails?
92. Why are they called this?
93. Describe the stems of horsetails.
94. Where does photosynthesis take place in horsetails?
95. How are horsetails anchored?
96. How do horsetails reproduce?
97. Where are their spores found?
98. In prehistoric times, what was true of the size of horsetails?
99. Describe the habitat of horsetails.
100. How do horsetails prevent water loss from the parts of the plant above ground?
101. What special spore dispersing structures are found on the spores of horsetails?
102. Describe how elaters work.
103. Label the stem, node, and leaves on this horsetail.
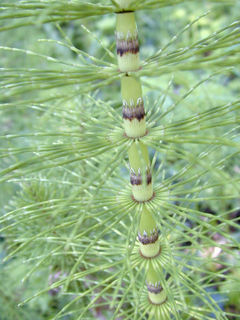
104. Give 3 other uses for horsetails.
a.
b.
c.
104. Can animals eat horsetails? Why or why not?
Division Pterophyta
105. Ferns are in the ____________ group of extant vascular plants.
106. Describe the habitats for ferns.
107. How do ferns reproduce asexually?
108. What stage is dominant in the life cycle of the fern?
109. What is the only part of the fern plant that appears above ground? What parts are found below ground?
110. Fern leaves are called ______________ and are attached to the plant by short stems called ______________.
111. Describe the appearance of newly forming fern fronds and tell what they are called.
112. What are sori and where are they found?
113. How are fern spores spread?
114. What forms when a fern spore lands on moist ground and germinates (starts growing)?
115. The prothallus starts what stage in the life cycle?
116. What is the shape of the gametophyte and does it live long?
117. What 2 structures grow ON the gametophyte?
118. Label the gametophyte and the male and female gametangia.
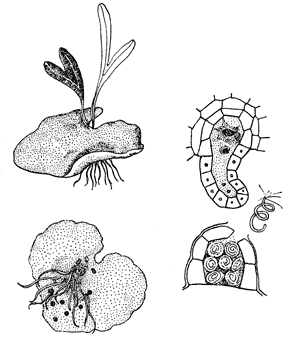
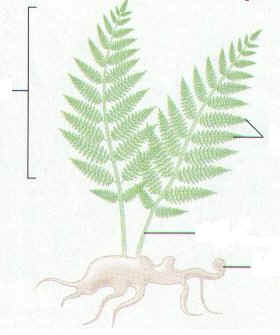
119. Label the parts of a fern.
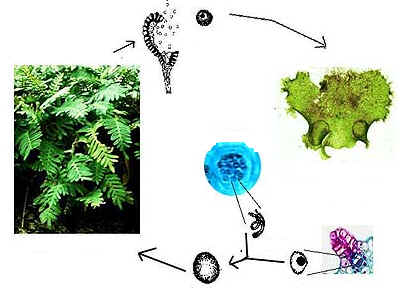
120. Label the life cycle of the fern.
121. Give 4 uses for ferns. a.
b.
c.
d.
Some major test grades will be determined by taking the square root of the student’s raw score (number of points correct). For example, if there are 50 questions on a test and each question counts 2 points each, a student who answers 35 questions correctly (70% of the total points possible or 70 points) will receive a score of √ 70 or 84%.
Use this table to find the squares and square roots of numbers from 1 to 100.
You can also use this table to estimate the square roots of larger numbers.
To get a more exact number, you will have to use a calculator (44.721 is the more exact square root of 2,000).
| Number | Square | Square root |
| 1 | 1 | 1.000 |
| 2 | 4 | 1.414 |
| 3 | 9 | 1.732 |
| 4 | 16 | 2.000 |
| 5 | 25 | 2.236 |
| 6 | 36 | 2.449 |
| 7 | 49 | 2.646 |
| 8 | 64 | 2.828 |
| 9 | 81 | 3.000 |
| 10 | 100 | 3.162 |
| 11 | 121 | 3.317 |
| 12 | 144 | 3.464 |
| 13 | 169 | 3.606 |
| 14 | 196 | 3.742 |
| 15 | 225 | 3.873 |
| 16 | 256 | 4.000 |
| 17 | 289 | 4.123 |
| 18 | 324 | 4.243 |
| 19 | 361 | 4.359 |
| 20 | 400 | 4.472 |
| 21 | 441 | 4.583 |
| 22 | 484 | 4.690 |
| 23 | 529 | 4.796 |
| 24 | 576 | 4.899 |
| 25 | 625 | 5.000 |
| 26 | 676 | 5.099 |
| 27 | 729 | 5.196 |
| 28 | 784 | 5.292 |
| 29 | 841 | 5.385 |
| 30 | 900 | 5.477 |
| 31 | 961 | 5.568 |
| 32 | 1,024 | 5.657 |
| 33 | 1,089 | 5.745 |
| 34 | 1,156 | 5.831 |
| 35 | 1,225 | 5.916 |
| 36 | 1,296 | 6.000 |
| 37 | 1,369 | 6.083 |
| 38 | 1,444 | 6.164 |
| 39 | 1,521 | 6.245 |
| 40 | 1,600 | 6.325 |
| 41 | 1,681 | 6.403 |
| 42 | 1,764 | 6.481 |
| 43 | 1,849 | 6.557 |
| 44 | 1,936 | 6.633 |
| 45 | 2,025 | 6.708 |
| 46 | 2,116 | 6.782 |
| 47 | 2,209 | 6.856 |
| 48 | 2,304 | 6.928 |
| 49 | 2,401 | 7.000 |
| 50 | 2,500 | 7.071 |
| 51 | 2,601 | 7.141 |
| 52 | 2,704 | 7.211 |
| 53 | 2,809 | 7.280 |
| 54 | 2,916 | 7.348 |
| 55 | 3,025 | 7.416 |
| 56 | 3,136 | 7.483 |
| 57 | 3,249 | 7.550 |
| 58 | 3,364 | 7.616 |
| 59 | 3,481 | 7.681 |
| 60 | 3,600 | 7.746 |
| 61 | 3,721 | 7.810 |
| 62 | 3,844 | 7.874 |
| 63 | 3,969 | 7.937 |
| 64 | 4,096 | 8.000 |
| 65 | 4,225 | 8.062 |
| 66 | 4,356 | 8.124 |
| 67 | 4,489 | 8.185 |
| 68 | 4,624 | 8.246 |
| 69 | 4,761 | 8.307 |
| 70 | 4,900 | 8.367 |
| 71 | 5,041 | 8.426 |
| 72 | 5,184 | 8.485 |
| 73 | 5,329 | 8.544 |
| 74 | 5,476 | 8.602 |
| 75 | 5,625 | 8.660 |
| 76 | 5,776 | 8.718 |
| 77 | 5,929 | 8.775 |
| 78 | 6,084 | 8.832 |
| 79 | 6,241 | 8.888 |
| 80 | 6,400 | 8.944 |
| 81 | 6,561 | 9.000 |
| 82 | 6,724 | 9.055 |
| 83 | 6,889 | 9.110 |
| 84 | 7,056 | 9.165 |
| 85 | 7,225 | 9.220 |
| 86 | 7,396 | 9.274 |
| 87 | 7,569 | 9.327 |
| 88 | 7,744 | 9.381 |
| 89 | 7,921 | 9.434 |
| 90 | 8,100 | 9.487 |
| 91 | 8,281 | 9.539 |
| 92 | 8,464 | 9.592 |
| 93 | 8,649 | 9.644 |
| 94 | 8,836 | 9.695 |
| 95 | 9,025 | 9.747 |
| 96 | 9,216 | 9.798 |
| 97 | 9,409 | 9.849 |
| 98 | 9,604 | 9.899 |
| 99 | 9,801 | 9.950 |
| 100 | 10,000 | 10.000 |
NOTE: Square roots in this table are rounded to the nearest thousandth.
| Starfish Dissection |
Introduction:

Echinoderms are radially symmetrical animals that are only found in the sea (there are none on land or in fresh water). Echinoderms mean “spiny skin” in Greek. Many, but not all, echinoderms have spiny skin. There are over 6,000 species. Echinoderms usually have five appendages (arms or rays), but there are some exceptions.
Radial symmetry means that the body is a hub, like a bicycle wheel, and tentacles are spokes coming out of it (think of a starfish). As larvae, echinoderms are bilaterally symmetrical. As they mature, they become radially symmetrical.
Most adult echinoderms live on the bottom of the ocean floor. Many echinoderms have suckers on the ends of their feet that are used to capture and hold prey, and to hold onto rocks in a swift current.
Sea Stars
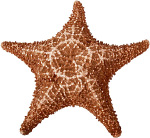
Sea stars (group name Stelleroidea) are sometimes called starfish, though they are not real fish (they lack both vertebrae and fins). There are two sub-types of sea stars:
The differences between the two sub-types lies in how the arms connect to the central disk. Ophiuroids have arms that do not connect with each other. There is a distinct boundary between arm and central disk. Asteroids have arms that are connected to each other. Also, it is harder to tell with asteroids where the central disk ends and the arms begin.
The sea star’s top surface (or skin) looks spiny if you examine it. If you look very closely you will notice that there are different types of growths on the surface. Some bumps are used to absorb oxygen, they are called dermal branchiae. Pedicellaria are pincher-like organs used to clean the surface of the skin. Barnacle larvae could land on a sea star and start growing if it were not for these organs.
How Do Sea Stars Move?
Each sea star had hundreds of tiny feet on the bottom of each ray. These are tube feet, or podia. These tiny feet can be filled with sea water. The vascular system of the sea star is also filled with sea water. By moving water from the vascular system into the tiny feet, the sea star can make a foot move by expanding it. This is how sea stars move around. Muscles within the feet are used to retract them.
Each ray of a sea star has a light sensitive organ called an eyespot. Though it can not see nearly as well as we do, sea stars can detect light and its general direction. They have some idea of where they are going.
Can Sea Stars Grow New Arms?
Given enough time, sea stars can grow back arms that have been damaged or removed. For a few species, the severed arm can grow back into a complete sea star! For most sea stars, however, a severed limb dies.
What Do Sea Stars Eat?
Sea stars eat many things. A sea star’s diet can include: barnacles, snails, sea urchins, clams, and mussels. A few species, such as the spiny star of the North Atlantic, eat other sea stars! Many sea stars eat mussels and clams in an interesting way. They surround the shell and use the suckers on their feet to pull the two shells (or valves) apart. The sea star has enough force in its arms to actually bend the shell! This creates an opening between the two shells that is only .01 inches wide. Using this tiny gap, the sea star puts its stomach into the clam’s shell and eats its insides. When it is done, nothing is left but an empty shell.
Materials:
Preserved starfish, dissecting pan, scissors, scalpel, forceps, T-pins, pencil, lab apron, safety glasses
Procedure:
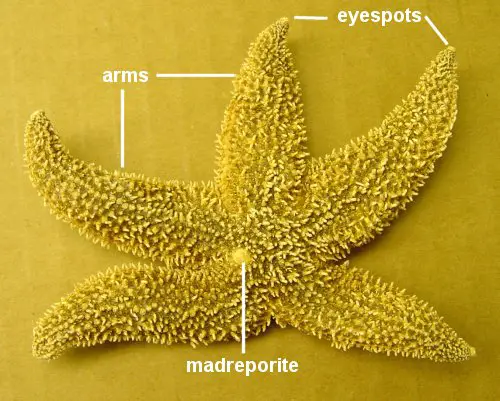
Dorsal view of starfish showing external anatomy
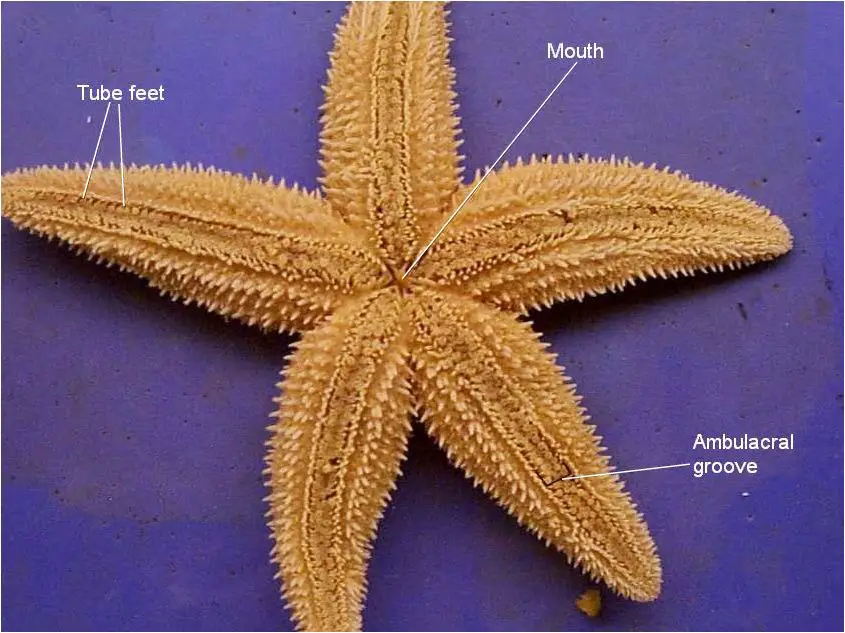
Ventral view of starfish showing external anatomy
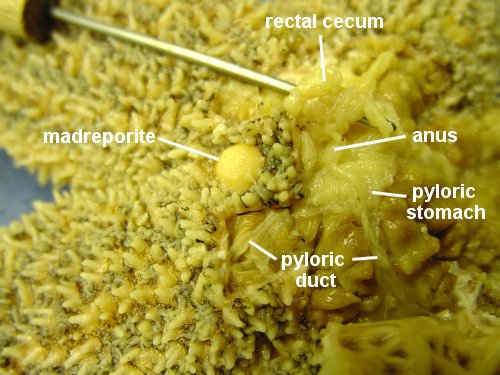
Dorsal view of a dissected starfish showing rectal cecum, anus, madreporite, pyloric stomach, pyloric duct
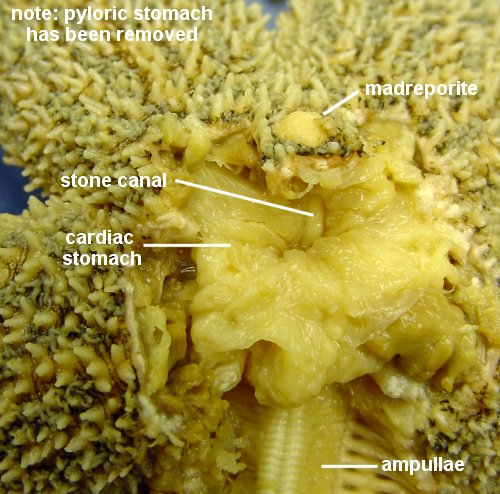
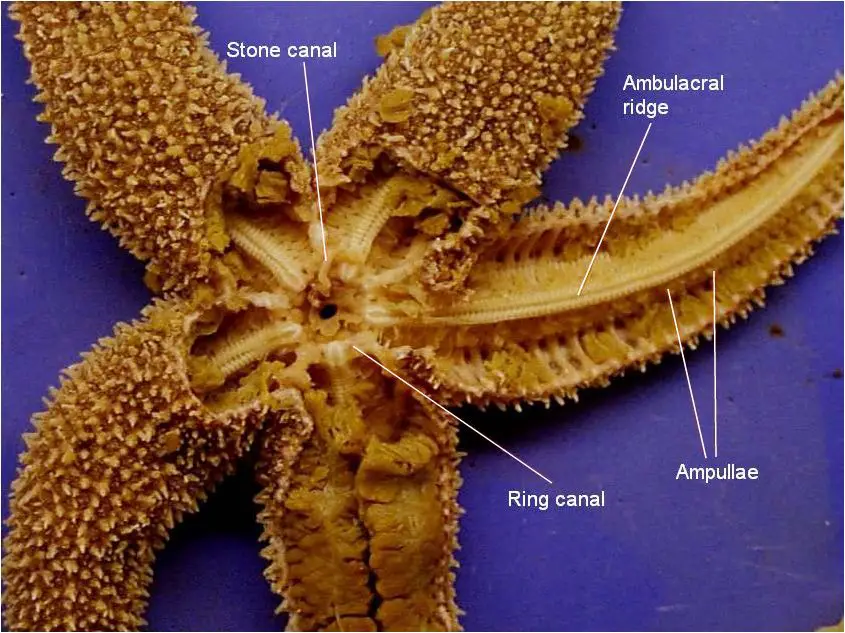
Dorsal view of a dissected starfish showing madreporite, stone canal, cardiac stomach, and ampullae

Dissection showing where cardiac stomach opens into the mouth
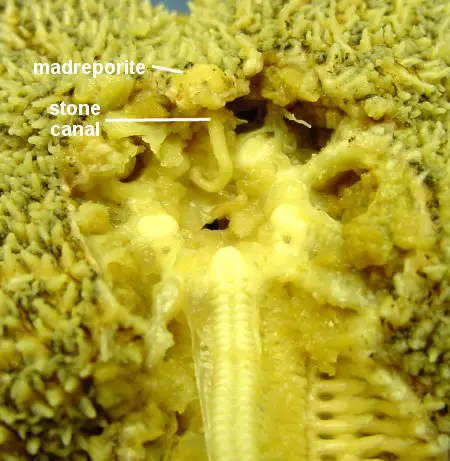
Close up of madreporite and stone canal
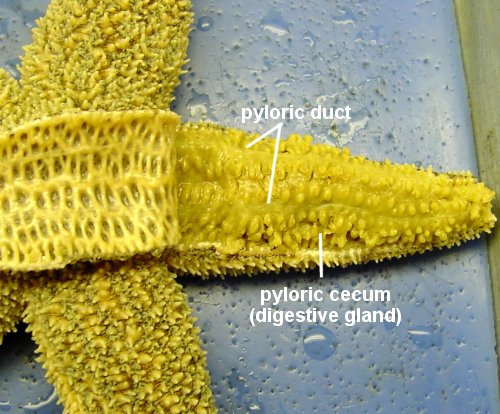
Dorsal view of a dissected starfish showing pyloric caecum and pyloric ducts

Dorsal view of a dissected starfish showing gonads and ampullae
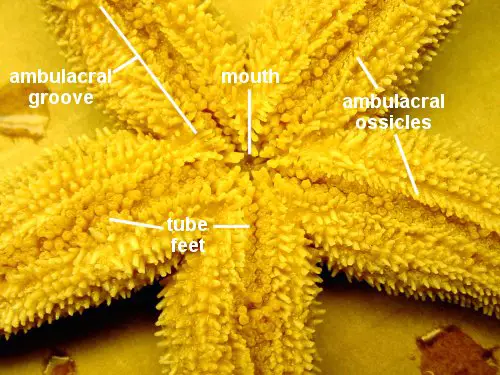
Ventral view of starfish showing external anatomy