Energy in food


The Heat is On – The Energy Stored in Food
Introduction:

Plants utilize sunlight during photosynthesis to convert carbon dioxide and water into glucose (sugar) and oxygen. This glucose has energy stored in its chemical bonds that can be used by other organisms. This stored energy is released whenever these chemical bonds are broken in metabolic processes such as cellular respiration.

Cellular respiration is the process by which the chemical energy of “food” molecules is released and partially captured in the form of ATP. Cellular respiration is the general term which describes all metabolic reactions involved in the formation of usable energy from the breakdown of nutrients. In living organisms, the “universal” source of energy is adenosine triphosphate (ATP). Carbohydrates, fats, and proteins can all be used as fuels in cellular respiration, but glucose is most commonly used as an example to examine the reactions and pathways involved.

Marathon runners eat a large plate of pasta the night before a competition because pasta is a good source of energy, or fuel for the body. All foods contain energy, but the amount of potential energy stored will vary greatly depending on the type of food. Moreover, not all of the stored energy is available to do work. When we eat food, our bodies convert the stored energy, known as Calories, to chemical energy, thereby allowing us to do work. A calorie is the amount of heat (energy) required to raise the temperature of 1 gram (g) of water 1 degree Celsius (°C). The density of water is 1 gram per milliliter (1g/ml) therefore 1 g of water is equal to 1 ml of water. When we talk about caloric values of food, we refer to them as Calories (notice the capital “C”), which are actually kilocalories. There are 1000 calories in a kilocalorie. So in reality, a food item that is listed as having 38 Calories has 38,000 calories. Calories are a way to measure the energy you get from the food you eat.

Just as pasta can provide a runner energy to run a marathon, a tiny peanut contains stored energy that can be used to heat a container of water. For this lab exercise, you will indirectly measure the amount of Calories in couple of food items using a calorimeter. A calorimeter (calor = Latin for heat) is a device that measures the heat generated by a chemical reaction, change of state, or formation of a solution. There are several types of calorimeters but the main emphasis of all calorimeters is to insulate the reaction to prevent heat loss. We will be using a homemade calorimeter modeled after a constant-volume calorimeter. A particular food item will be ignited, the homemade calorimeter will trap the heat of the burning food, and the water above will absorb the heat, thereby causing the temperature (T) of the water to increase. By measuring the change in temperature (∆T) of a known volume of water, you will be able to calculate the amount of energy in the food tested


Objective:


In this experiment, you will measure the amount of energy available for use from three types of nuts, a plant product. This process of measuring the energy stored in food is known as calorimetry.

Materials:
large paper clip, oC thermometer, soft drink can, soft drink can with openings cut into the side, mixed nuts, matches, water, electronic balance, pencil & paper, 100 ml graduated cylinder, calculator

Procedure:

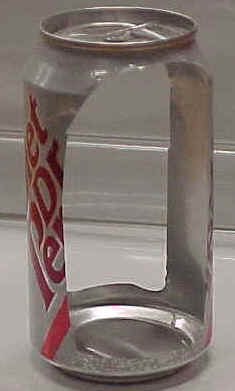
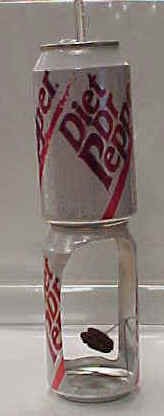
  1. Carefully, cut out two openings along the side of a soft drink can. This will serve as your support for the second drink can that will contain water & sit on top.

  1. Bend a large size paper clip so that a nut can be attached on one end and the other end will sit flat inside the cut-out soft drink can.


  1. Use the graduated cylinder to accurately measure 100g (100ml) of water. Pour this water into the uncut soft drink can.
  2. Place the thermometer in the uncut can and measure the water temperature after 3 minutes.  Record this temperature on  data table 1.

  1. Mass the nut (g) that you will burn and record this mass on  data table 1.
  2. Attach the nut to the bent end of your paper clip and carefully set the clip & nut into the cut-out soft drink can on bottom. Make sure the cans are sitting on a flat, nonflammable surface!

  1. Carefully light the nut from the bottom using a match and record the change in water temperature as the nut burns (thermometer in the can during burning). Immediately after the nut finishes burning, record the final (highest) water temperature on data table 1.
  2. Measure the mass (g) of the remaining nut & record this in the data table 1. (Mass the burned nut and paper clip together and then subtract the mass of the nut to get the mass of the nut alone.)
  3. Complete the data table1 by calculating the change in mass of the nut.
  4. Repeat this experiment with the other two types of nuts .
  5. When all three nuts have been burned, complete the analysis on data table 2.

Results:


Table 1 – Results of Burning

PECAN WALNUT ALMOND
oC  H2O temperature Before burning
oC
 
oC  H2O temperature After burning
oC
Difference in oC H2O temperature
oC
Mass of Paper Clip
g
Mass of Nut Before Burning
Mass of Paper Clip and Nut After Burning
g
Mass of Nut ALONE After Burning
(Subtract paper clip mass from mass of nut & paper clip after burning)
g
(Subtract paper clip mass from mass of nut & paper clip after burning)
g


Table 2 – Data Analysis from Nut Calorimetry

PECAN WALNUT ALMOND
Mass Difference of Nut Before & After Burning

(Subtract mass of nut after burning from Mass of nut before burning)
g

Temperature Difference of H2O Before & After Burning
(Subtract original water temp. from final water temp.)
oC
Calories Required to Change the Temperature of 100 g of H2O
(Multiply temperature change by 100)Cal
Average Calories per gram in the Nut
(Divide the total calories by the mass difference of the nut before & after burning)Cal/g
Average kilocalories or food calories per gram
(Divide the calories per gram by 1000)kcal/g


Questions & Conclusion:

  1. Where did the energy stored in the nut originally come from?
  2. During what process was this energy stored in the nut, & where specifically was it stored?
  3. What simple sugar made by plants is a common source for stored energy?
  4. Which group of macromolecules would a nut contain — carbohydrates, lipids, or protein?
  5. What is the name for stored energy?
  6. Give some examples of how organisms would use this stored energy.
  7. In this experiment, discuss what happened to the energy stored in the nut.
  8. Why was the final mass of the nut less than the original mass of the nut? (Remember that matter can’t be destroyed in a chemical reaction.)


BACK

Energy in Food Writeup

Energy in Food Write Up

Introduction:

Use your lab and your textbook to locate and include the following information in your introduction.

  • What organisms are capable of making their own food?
  • What process do they use to do this?
  • Where do these organisms get their energy for food-making?
  • This energy is captured with the help of what pigment?
  • This energy is stored in what organic molecules?
  • Where exactly in the organic molecules is the energy stored and so it can be used again later? (Hint: Energized electrons form these and then energy is released again when they are broken.)
  • What process takes place in plants & animals to release energy?
  • What gas is required for the process to occur?
  • When foods are “burned” in our bodies, where is the energy being released from? Where did this energy originally come from?
  • What is the usable form of energy for our cells?
  • Define calorimetry and explain how it can be used to measure energy stored in chemical bonds of food.

Hypothesis:

  • Write a statement explaining that calorimetry can be used to detect the amount of energy stored in the chemical bonds of foods.

Materials:

In sentence form, write a statement listing the materials required for this lab.

Procedure:

  • In paragraph form, write the procedures for completing this lab.

Results:

  • Draw and fill in table 1 showing the results of burning
  • Draw and fill in table 2 showing your data analysis for nut calorimetry
  • Write out and answer the questions on the lab. Remember to write and underline the question, but do NOT underline the answer.

Conclusion: (Write in paragraph form.)

  • Restate your hypothesis.
  • Tell how were you able to measure the amount of energy in each nut
  • Did all three nuts contain the same amount of food energy? Explain by giving data from your experiment..
  • Explain why some foods contained more energy than others
  • Tell where this energy originally come from and how it got into the nuts
  • Explain any errors you might have made in lab that could have affected your results

Description

Description: The purpose of this experiment is to determine the types of pigments found in various vegetation. The students will gather plants, soak them in acetone and use coffee filter strips to separate the pigments. Then the students will determine the pigments found in each type of leaf. The pigments found in spinach leaves, lettuce leaves and marigold leaves are all different. Paper Chromatography is a technique that enables us to separate plant pigments. The pigments found in plants vary and the process of chromatography is important in the detection of the types of pigments found in each.

Needed Materials: Acetone fingernail polish remover, test tubes or other empty containers (enough for 5 containers per group), felt tip markers, coffee filters, pigment guide, masking tape, scissors, spinach leaves, mum leaves, iceberg lettuce and leaves of various plants found in your schoolyard.

Safety Rule: Avoid inhaling the vapors from the acetone and spilling it on your clothing.

Procedure:

Student Information: The following information will provide you with the steps for conducting your plant chromatography experiment. It is important to hold all of the variables constant except for those that are being manipulated. Constant (or controlled variables) would be such things as: the length of the filter paper strip, the amount of time the paper is left in the solution, the amount of acetone in the container, the size of the container being used, etc. Manipulated (or independent) variables would be those things that we change to see if the response will be different, such as: type of plant being studied. The responding (or dependent) variable for this experiment will be the different pigments found in each of the different types of vegetation.

The reporting form for this experiment is set up so that you can determine how many different kinds of vegetation you would like to use, the kind of container you would like to use and how long your strips of filter paper will be. Also remember that a good scientific experiment is repeated a minimum of three times. Therefore, your data will be more accurate if you conduct several experiments that are exactly the same and then compile an average of your data before submitting it.

Procedural Steps for Conducting the Investigation

  • 1. Collect two different plants from your schoolyard. You are going to test these two plants along with the spinage, mum leaves, and iceburg lettuce.
  • 2. Label each container with the kind of plant you are testing.
  • 3. Place a different leaf in the bottom of each test tube and crush it.
  • 4. Pour about 2 cm. of acetone (fingernail polish remover) into each of your test tubes.
  • 5. Let this sit twenty-four hours.
  • 6. Cut five strips out of the middle of a coffee filter.
  • 7. Place the end of one coffee filter strip in each of the test tubes. The solvent will travel up the paper, and as it does, it will dissolve and deposit the separate pigments.
  • 8. After twenty-four hours, check your results.
  • 9. Remove the strips of paper from the test tubes and lay them on dry paper towels that are labeled with the type of plant extract found on that strip.
  • 10. Use a magnifying glass and a pigmentation guide to determine the types of pigments in each extract.

Discussion Questions

  • What were your conclusions for this experiment?
  • What could you infer based on your conclusions?
  • How would you design this experiment differently the next time?
  • What types of pigments were found in each type of plant?
  • Did the color of the leaf affect the pigments found it them?
  • If the answer to the above question is “yes”, which leaves had the most variation in the kinds of pigments found in them?
  • Did certain leaves have the exact same pigments?
  • If the answer to the above question was “yes”, were the leaves similar in other ways?
  • Do you think the amount of sunlight a plant receives affects the pigments found in the plants? How could you test your predictions experimentally?
    • Would you expect to find the same results year round? How could you test your predictions experimentally?


Design Controlled Experiment


Developing a Controlled Experiment

Directions: Using your knowledge of the Scientific Method, complete the following situations.

1. Define hypothesis? 

2. Define experimental variable? 

3. Why is it important for an experiment to contain a control? 

4. Develop a controlled experiment to back up the following hypothesis:

The temperature of a lake has an effect on a fish’s ability to produce viable offspring.

  1. List the equipment needed to carry on this experiment.
  2. List the steps of the controlled experiment so that any one can follow.
  3. What is the experimental variable?
  4. What are the control(s) of the experiment?
BACK

Dichotomous Key

Dichotomous Key

The identification of biological organisms can be greatly simplified using tools such as dichotomous keys.  A dichotomous key is an organized set of couplets of mutually exclusive characteristics of biological organisms.  You simply compare the characteristics of an unknown organism against an appropriate dichotomous key.  These keys will begin with general characteristics and lead to couplets indicating progressively specific characteristics. If the organism falls into one category, you go to the next indicated couplet.  By following the key and making the correct choices, you should be able to identify your specimen to the indicated taxonomic level.

Sample key to some common beans used in the kitchen:


Pinto


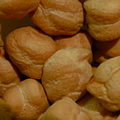
1a. Bean round Garbanzo bean
1b. Bean elliptical or oblong Go to 2
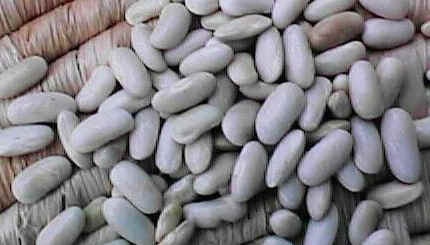
2a. Bean white White northern
2b. Bean has dark pigments Go to 3
3a. Bean evenly pigmented Go to 4
3b. Bean pigmentation mottled Pinto bean
4a. Bean black Black bean
4b. Bean reddish-brown Kidney bean

Click here for correct answers