Description

Description: The purpose of this experiment is to determine the types of pigments found in various vegetation. The students will gather plants, soak them in acetone and use coffee filter strips to separate the pigments. Then the students will determine the pigments found in each type of leaf. The pigments found in spinach leaves, lettuce leaves and marigold leaves are all different. Paper Chromatography is a technique that enables us to separate plant pigments. The pigments found in plants vary and the process of chromatography is important in the detection of the types of pigments found in each.

Needed Materials: Acetone fingernail polish remover, test tubes or other empty containers (enough for 5 containers per group), felt tip markers, coffee filters, pigment guide, masking tape, scissors, spinach leaves, mum leaves, iceberg lettuce and leaves of various plants found in your schoolyard.

Safety Rule: Avoid inhaling the vapors from the acetone and spilling it on your clothing.

Procedure:

Student Information: The following information will provide you with the steps for conducting your plant chromatography experiment. It is important to hold all of the variables constant except for those that are being manipulated. Constant (or controlled variables) would be such things as: the length of the filter paper strip, the amount of time the paper is left in the solution, the amount of acetone in the container, the size of the container being used, etc. Manipulated (or independent) variables would be those things that we change to see if the response will be different, such as: type of plant being studied. The responding (or dependent) variable for this experiment will be the different pigments found in each of the different types of vegetation.

The reporting form for this experiment is set up so that you can determine how many different kinds of vegetation you would like to use, the kind of container you would like to use and how long your strips of filter paper will be. Also remember that a good scientific experiment is repeated a minimum of three times. Therefore, your data will be more accurate if you conduct several experiments that are exactly the same and then compile an average of your data before submitting it.

Procedural Steps for Conducting the Investigation

  • 1. Collect two different plants from your schoolyard. You are going to test these two plants along with the spinage, mum leaves, and iceburg lettuce.
  • 2. Label each container with the kind of plant you are testing.
  • 3. Place a different leaf in the bottom of each test tube and crush it.
  • 4. Pour about 2 cm. of acetone (fingernail polish remover) into each of your test tubes.
  • 5. Let this sit twenty-four hours.
  • 6. Cut five strips out of the middle of a coffee filter.
  • 7. Place the end of one coffee filter strip in each of the test tubes. The solvent will travel up the paper, and as it does, it will dissolve and deposit the separate pigments.
  • 8. After twenty-four hours, check your results.
  • 9. Remove the strips of paper from the test tubes and lay them on dry paper towels that are labeled with the type of plant extract found on that strip.
  • 10. Use a magnifying glass and a pigmentation guide to determine the types of pigments in each extract.

Discussion Questions

  • What were your conclusions for this experiment?
  • What could you infer based on your conclusions?
  • How would you design this experiment differently the next time?
  • What types of pigments were found in each type of plant?
  • Did the color of the leaf affect the pigments found it them?
  • If the answer to the above question is “yes”, which leaves had the most variation in the kinds of pigments found in them?
  • Did certain leaves have the exact same pigments?
  • If the answer to the above question was “yes”, were the leaves similar in other ways?
  • Do you think the amount of sunlight a plant receives affects the pigments found in the plants? How could you test your predictions experimentally?
    • Would you expect to find the same results year round? How could you test your predictions experimentally?


Design Controlled Experiment


Developing a Controlled Experiment

Directions: Using your knowledge of the Scientific Method, complete the following situations.

1. Define hypothesis? 

2. Define experimental variable? 

3. Why is it important for an experiment to contain a control? 

4. Develop a controlled experiment to back up the following hypothesis:

The temperature of a lake has an effect on a fish’s ability to produce viable offspring.

  1. List the equipment needed to carry on this experiment.
  2. List the steps of the controlled experiment so that any one can follow.
  3. What is the experimental variable?
  4. What are the control(s) of the experiment?
BACK

Dichotomous Key

Dichotomous Key

The identification of biological organisms can be greatly simplified using tools such as dichotomous keys.  A dichotomous key is an organized set of couplets of mutually exclusive characteristics of biological organisms.  You simply compare the characteristics of an unknown organism against an appropriate dichotomous key.  These keys will begin with general characteristics and lead to couplets indicating progressively specific characteristics. If the organism falls into one category, you go to the next indicated couplet.  By following the key and making the correct choices, you should be able to identify your specimen to the indicated taxonomic level.

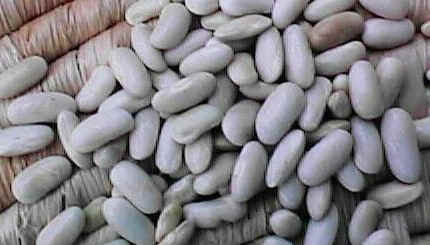
Sample key to some common beans used in the kitchen:


Pinto


1a. Bean round Garbanzo bean
1b. Bean elliptical or oblong Go to 2
2a. Bean white White northern
2b. Bean has dark pigments Go to 3
3a. Bean evenly pigmented Go to 4
3b. Bean pigmentation mottled Pinto bean
4a. Bean black Black bean
4b. Bean reddish-brown Kidney bean

Click here for correct answers


Dichotomous Key Activity


Dichotomous Key Activity


Directions: Give each of the following creatures a name. You may want to print this out before you proceed.


1. ________________

5. _________________

8. ___________________

2. ________________

4. __________________

6. __________________

9. ___________________

3. __________________

7. _________________

10. __________________


Chromatography of Simulated Plant Pigments


Chromatography of Simulated Plant Pigments


Introduction
    This experiment is conducted to investigate the components Plant Pigments separating visibly. There are a couple of different types of components in plant pigments, and they became clearly visible during this lab. The most important and abundant chemical pigment found in plants is chlorophyll. This pigment exists in two forms; chlorophyll a and chlorophyll b. Chlorophyll absorbs two main colors from light quite well. These are blue, and red. The chlorophyll reflects green light very well, however, the two different types of chlorophyll have their maximum absorption at different wavelengths of light. Chlorophyll a, being the main photosynthetic pigment, has a primary purpose to convert light energy to chemical energy used by the plant itself. Chlorophyll b absorbs light in a region of the spectrum apart from the dominant chlorophyll, and transfers the energy it produces to chlorophyll a. Along with chlorophyll b in transferring their energy produced to the dominant chlorophyll, two other pigments that are found in plants are carotenes and xanthophylls, which are orange and yellow respectively. Since chlorophyll is such a dominant pigment in green plants, this domination hides the color of the carotenes and xanthophylls in the leaves. This causes most plant leaves to appear green most of the time. During the autumn, however, the chlorophyll starts to break down, causing the carotenes and xanthophylls to show their bright red, orange and yellow colors.
These brilliant colors can be separated another way. This different technique, known as paper chromatography, separates mixtures in a liquid into individual components. The technique is based on the fact that each substance in a mixture has a specific affinity for a solid surface and a specific solubility in different solvents. By this method, the solid surface is the cellulose fibers in the chromatography paper, and the solvent is the solution that was placed in the bottom of the developing chamber.
This separation takes place through a process of absorption and capillary action. Just a small drop of the mixture, in this case plant pigment to be separated, is placed at the bottom of the strip of chromatography paper. The chromatography paper is then placed in the developing chamber with a solvent, which wicks up the paper, pulling the solvent up the paper by capillary action, and the mixture of pigments is dissolved as the solvent passes over it. The different components of the mixture move upward at different rates. A compound with greater solubility will travel farther than one with less solubility. The pigments then show up as color streaks on the chromatography paper. These substances have formed a pattern called a chromatogram on the chromatography paper.
The Rf values for each pigment is calculated to establish the relative rate of migration for each pigment. This value represents the ratio of the distance a pigment traveled on the chromatogram relative to the distance the solvent front moved.
Scientists use the Rf value of a sample to identify the molecule. Any molecule in a given solvent matrix system has a uniquely consistent Rf value. The formula for this value is as follows:

Rf = Distance each pigment traveled ¸ Distance solvent front traveled


Hypothesis
    Using paper chromatography, the pigments that give a leaf its color can be separated and observed to determine the Rf value of each pigment and their function during photosynthesis.


Materials
For this experiment the following items are used — one chromatography reaction chamber, one paper chromatography strip, one capillary pipette, a pencil and paper, calculator, ruler, 50 ml beaker, colored pencils, approximately 10 ml of solvent depending on the size of the reaction chamber, scissors, and simulated plant pigment.


Procedure
Use scissors to cut the bottom of the chromatography paper to a tapered end. Measure the strip and cut the length to equal slightly longer than the reaction chamber. Draw a faint pencil line at the bottom of the tapered end and use a capillary pipette to add some simulated plant pigment to this line. Add 5-10 ml of solvent to the reaction chamber. Extend the chromatography strip through the slit in the lids of the reaction chamber and carefully lower the strip into the chamber so the tapered end is in the solvent and the pencil line is above the solvent level. Make sure the strip does not touch the walls of the chamber and do not bump the chamber as the pigments begin to separate. After the pigments have completely separated and the solvent front has reached the top of the chamber, remove the strip and mark the solvent front with a pencil line before it evaporates. Measure and record the distance the solvent and each pigment traveled. Use a calculator to determine the Rf values for each pigment.


Data


Table 1

Band # Pigment Color Migration distance (mm) Rf value
1 Carotene Orange 59mm .94
2 Xanthophyll Yellow 56mm .89
3 Chlorophyll a Light green 29mm .46
4 Chlorophyll b Dark green 14mm .22
Solvent 63mm

Questions
1. Describe what happened to the original spot of simulated plant pigments?
  The solvent separated  the original spot by wicking up the solvent while dissolving the various pigments in the spot.
2. List some other uses of chromatography?  Chromatography can be used to separate various mixtures of subtances, liquids and gases.
3. Which of the 4 pigments migrated the furthest and why?  carotene ( orange) because it was the most soluble in the solvent
4. Which type of chlorophyll was the most soluble?  chlorophyll a
5. Explain why leaves change color in the fall?  In Autumn, chlorophyll starts to break down which allows the other brilliant plant pigment colors to show. These pigments include the red, orange, and yellow colors.
6. What is the function of plant pigments in photosynthesis?  Plant pigments trap light energy and convert it into chemical energy that can be used by the plant to make glucose or sugar.

Error Analysis
The chromatography paper touched the sides of the chamber during the waiting time which caused the migration to go slightly to the side instead of straight to the top. Also the strip was bent at the top so there could have been a slight error in measuring the migration of the solvent  front.

Conclusion
Paper chromatography proved to be an accurate method of separating and observing the various colors of plant pigments. The pigments dissolved in the solvent and migrated upward. The colors were observed and their migration distances measured & recorded. The
Rf value of each pigment was determined by dividing its migration by the migration of the solvent.  It was determined that 4 pigments were present in the original spot — carotene, xanthophyll, chlorophyll a, and chlorophyll b. Carotene was the most soluble, while chlorophyll b was the least soluble.