Genetics Study Guide BI

Genetics Study Guide 

The two genes or alleles that combine to determine a trait would be the organism’s _______________.
Type AB blood, having two genes dominant for a trait, is an example of ________.
State Mendel’s law of segregation.
Rr x Rr is an example of what type of cross —– P1, F1, or F2?
If both alleles are the same in a genotype, is the genotype homozygous or heterozygous?
Which cross is a cross between two hybrids —– P1, F1, or F2?
__________ dominance results in the blending of genes in the hybrid. Give an example using flower color.
What is another term for a heterozygous genotype?
The _____________ is the physical feature such as round peas that results from a genotype.
How many traits are involved in a monohybrid cross?
What type of organism was used in the first genetic studies done by Gregor Mendel?
What is a karyotype?
The two genes for a trait represented by capital & lower case letters are called __________.
How many traits are involved in a dihybrid cross?
Which of Mendel’s laws states that the dominant gene in a pair will be expressed?
If both alleles are the same, is the genotype homozygous or heterozygous? Write an example.
Write an example of a hybrid or heterozygous genotype.
The genes for sex-linked traits are only carried on which chromosome?
Who is considered to be the “father of genetics”?
A second filial or F2 cross is also called a ____________ cross.
The failure of chromosomes to separate during meiosis (egg & sperm formation) is known as _________________.
A cross between two pure or homozygous organisms is called what type of cross —– P1, F1, or F2?
What genetic disorder results from a sex-linked trait that affects color vision?
The genetic disorder called _______________ is known as the “free bleeders” disease.
Having three 21st chromosomes causes the genetic disorder known as _________.
A person suffering from the genetic disorder called ______________ can not digest fats.
_____________________ disease is a genetic disorder where red blood cells carry less oxygen.
Work a P1 cross for plant height in peas.
Work an F1 cross for plant height in peas.
BACK


Genetic Traits Activity


Finding Your Genetic Match

Introduction:

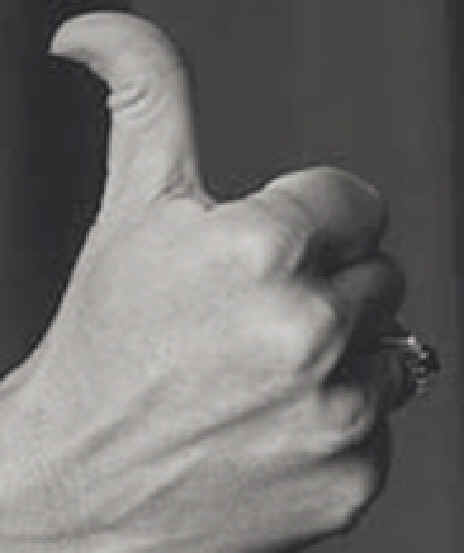
Have you ever noticed that brothers or sisters often look alike?  Their inherited traits are what make their physical appearance so similar. An inherited trait is a particular genetically determined characteristic that distinguishes a person. The traits of children are determined by the traits that  are passed on from their parents. Some traits are obvious in a family — a child’s nose is shaped like their mother’s nose, but some traits are less obvious. You may have similar traits to many of your classmates even though you are not related to them. Some examples of often un-noticed human traits are the ability or not to roll your tongue, attached or unattached earlobes, dimples or freckles, naturally curly or straight hair, hitchhiker’s or straight thumb, straight or widow’s peak hairline, smooth or cleft chin, or colorblindness or normal vision.

There are numerous traits in humans, but some traits occur more frequently than others.  Between 70-90% of the human population have free-hanging earlobes, can roll their tongue,  are right-handed, and can taste a chemical called PTC.  These traits are called high frequency traits.

Objective:

Students will determine the presence of certain high frequency traits in themselves & their classmates.

Materials:

Genetic Inventory sheet with pictures, paper, pencil, PTC taste strips.

Procedure:

  1. Identify which of the following 10 human traits you have by placing a check mark beside that trait.
  2. Compare the traits you have with other students in the classroom and find the student you most closely match.


Human Trait Inventory
Student:
Tongue Roller
Non-Tongue Roller
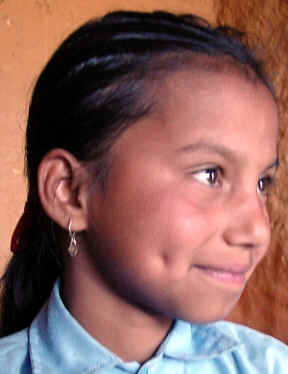
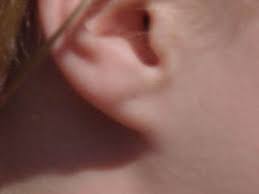
Attached Earlobes
Unattached earlobes
Dimples
No Dimples
Right-handed
Left-Handed
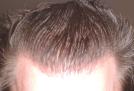
Widow’s Peak
Straight Hairline
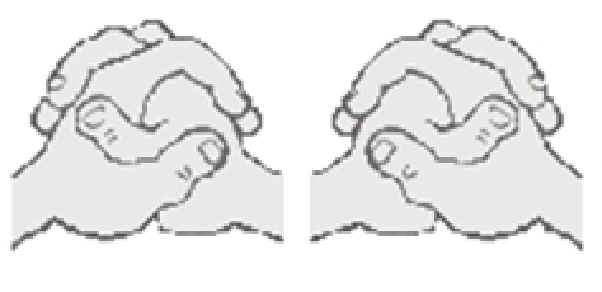
Left Thumb on top when Hands Crossed
Right Thumb on top when Hands Crossed
Hair on mid-digit of hand
No hair on mid-digit of hand
Bent little finger
Straight little finger
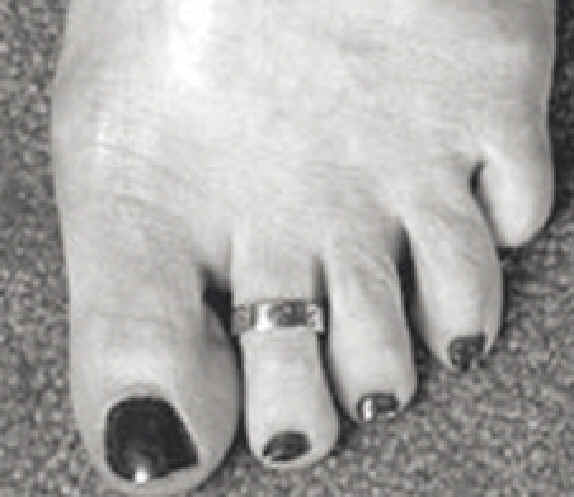
Second toe longer than big toe
Second toe not longer than big toe
Can Taste PTC
Can Not Taste PTC
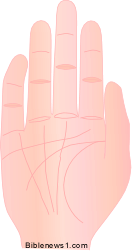
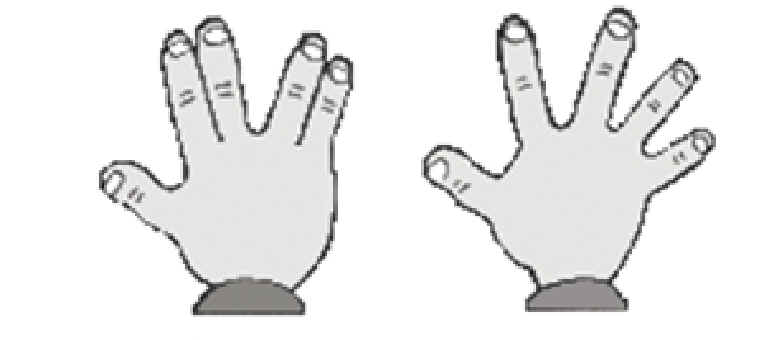
Vulcan (Fingers spread 2 by 2)
None Vulcan
Class Match:


Tongue Roller Non Roller Dimples No Dimples
Attached Earlobes Unattached Earlobes Widow’s Peak Straight Hairline
Longer Second Toe Short Second Toe Bent Little finger Hitchhiker’s Thumb
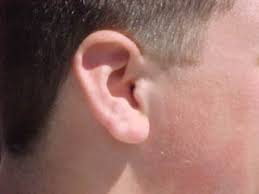
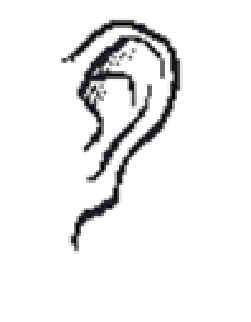
Attached Ear lobes (left)
Unattached ear Lobes (right)
“VULCAN” or No “VULCAN” Dimples Right/Left Thumb on top


Graph Examples

Examples of Graphs

LINE GRAPHS
Line Graph title

A line graph is most useful in displaying data or information that changes continuously over time. The example below shows the changes in the temperature over a week in January. Notice that the title of the graph is “Average Daily Temperature for January 1-7 in degrees Fahrenheit”.

To the left is a table that shows the date in one column and the corresponding temperature in the second column. The line graph on the right shows the degrees of temperature going up the vertical axis (up and down numbers on the left of the graph) and the days of the week on the horizontal axis (going sideways from left to right). The points for the temperature for each day are connected by a line – thus the graph is a line graph.

Average Daily Temperature for January 1-7 in Degrees Fahrenheit

Date
Temperature
1 10
2 25
3 30
4 42
5 23
6 25
7 40
Line Graoh of Average Temperatures


Bar Graph Animated title

BAR GRAPHS

Bar graphs are an excellent way to show results that are one time, that aren’t continuous – especially samplings such as surveys, inventories, etc. Below is a typical survey asking students about their favorite after school activity. Notice that in this graph each column is labeled – it is also possible to label the category to the left of the bar. In this case, the numbers for each category are across the bottom of the chart.

A bar chart is marked off with a series of lines called grid lines. These lines typically mark off a numerical point in the series of numbers on the axis or line. In this case, each grid line going up and down marks a multiple of 20 as the graph is divided.  More gridlines can make it easier to be exact with the amounts being shown on the bar graph, but too many can make it confusing.  Notice that for data that does not fall evenly on a multiple of 20, the bar is in between two grid lines.  Bar graphs are useful to get an overall idea of trends in responses – which categories get many versus few responses.

Favorite Student After School Activity

Activity Number
Visit W/Friends 175
Talk on Phone 168
Play Sports 120
Earn Money 120
Use Computers 65
Bar Graph

Circle Pie Graph Title

CIRCLE/PIE GRAPHS

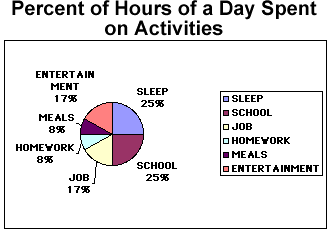
Circle or pie graphs are particularly good illustrations when considering how many parts of a whole are inception. In the table below both the number of hours in a whole day devoted to certain activities is listed as well as the percent of time for each of these activities. The pie chart is then divided very much as a baker’s pie would be into slices that represent the proportional amounts of time spent on each activity.

To the right of the pie chart is a legend that tells which color stands for which category. In addition, the percents are also near the pie slice that stands for that particular amount of time spent.

Percent of Hours of a Day Spent on Activities

ACTIVITY HOURS PERCENT OF DAY
Sleep 6 25
School 6 25
Job 4 17
Entertainment 4 17
Meals 2 8
Homework 2 8


Pie Graph of Day's Activities