Generalized Cell Structure

BACK
Generalized Cell Structure
BACK
| Mendelian Genetics PowerPoint Questions |
 |
||||||||||||||||||||||||||||||||
| Gregor Mendel
1. Who is responsible for our laws of inheritance? 2. What organism did Mendel study? 3. When was Mendel’s work recognized? 4. When did Mendel perform his experiments & how many plants did he grow? 5. What did Mendel notice about offspring traits? 6. How is Mendel referred to today? 7. In what country did Mendel do his research on peas? 8. Mendel stated that physical traits were inherited as _______________. 9. Today we know that particles are actually what? Terminology 10. Define these three terms:
b. heredity – c. genetics –
11. Name & describe two types of genetic crosses.
12. What is used to solve genetic crosses? 13. Sketch a Punnett square & show how they are used to solve a genetics problems.
14. Use a Punnett square to solve a cross between two parents that both have the genotype Yy.
15. What are alleles & what are the two forms?
16. Explain the difference between dominant & recessive alleles.
17. Using a letter of the alphabet, show how each allele would be represented.
18. What is a genotype and write 3 possible genotypes?
19. What is a phenotype and write possible phenotypes for your genotypes in question 18?
20. Using these alleles, R = red flower and r = yellow flowers, write all possible genotypes & phenotypes.
21. What are homozygous genotypes?
22. Write a homozygous dominant genotype. 23. Write a homozygous recessive genotype. 24. What is meant by a heterozygous genotype?
25. Write a heterozygous genotype. 26. Heterozygous genotypes are also called _____________. 27. What two things actually determine an organism’s characteristics? Pea Experiments 28. Give 4 reasons that Mendel used garden peas, Pisum sativum, for his experiments.
29. Name the male and female parts of a flowering plant and explain how pollination occurs.
30. What is the difference between self and cross pollination?
31. Explain how Mendel cross pollinated his pea plants.
32. How did Mendel get pure plants? 33. Name 8 pea plant traits and give the dominant & recessive form of each.
34. How did Mendel’s experimental results compare to the theoretical genotypic ratios? Explain.
35. What does P1 mean? 36. What is the F1 generation? 37. What is the F2 generation? 38. What results from this cross — TT x tt? 39. What results do you get from crossing two hybrids (Tt x Tt)?
40. Show all your work for solving a P1 monohybrid cross for seed shape. P1 cross: __________ x __________ Genotype ____________
41. The offspring of the above cross are called the _____ generation. 42. Show all your work for solving a F1 monohybrid cross for seed shape. F1 cross: __________ x __________ Genotype ____________ 43. Show all your work for solving both F2 monohybrid crosses for seed shape. Trait: F2 cross: ________ x ________ F2 cross: ________ x ________
Genotype ____________ Genotype ____________ Mendel’s Laws Complete the following question: 44. _________ are responsible for inherited traits. 45. Phenotype is based on _______________. 46. Each trait requires _____ genes, one from each ____________. 47. State the Law of Dominance and give an example.
48. State the Law of Segregation and tell when alleles are “recombined”.
49. State the Law of Independent assortment & tell what type of crosses show this.
50. Using the formula 2n where n = the number of heterozygotes, tell how many gametes will be produced by each of the following allele combinations: 51. What are the possible allele combinations in the egg and sperm from the following cross — RrYy x RrYy.
52. Show how to work an F1 dihybrid cross for seed shape & seed color. Traits:
F1 cross __________ x __________
GR Genotypes PR Phenotypes
53. Complete this cross or crosses for eye color & curliness of the hair — bbC__ x bbcc.
54. Draw a table summarizing Mendel’s 3 laws.
Incomplete and Co-Dominance 55. Incomplete dominance occurs in __________ and produces a phenotype _______________ the phenotype of the two parents. 56. Show your work solving a cross for flower color in snapdragons when there is incomplete dominance. Trait: Cross: RR x rr
Genotype ____________ 57. What is codominance & give an example?
58. Write the genotypes for each of these blood types: type A 59. Solve this codominance problem: IBIB x IAi.
60. Solve this codominance problem for blood type: ii x IAIB.
Sex-Linked Traits 61. What are sex linked traits?
62. Name the sex chromosomes. 63. Write the genotype for male and for female. 64. Most sex-linked traits are carried on what chromosome? 65. Give an example of a sex-linked trait in fruit flies. 66. Show the results of crossing a red-eyed male (XRY) with a white-eyed female (XrXr) fruit fly. Cross: __________ x __________
Genotype ____________ 67. What is meant by a female carrier?
68. Name a disease that can be carried in this manner.
|
|||||||||||||||||||||||||||||||||
The Nobel Prize in Physiology or Medicine for 2005
jointly to
Barry J. Marshall and J. Robin Warren
for their discovery of
“the bacterium Helicobacter pylori and its role in gastritis and peptic ulcer disease”
Introduction
This year’s Nobel Laureates in Physiology or Medicine made the remarkable and unexpected discovery that inflammation in the stomach (gastritis) as well as ulceration of the stomach or duodenum (peptic ulcer disease) is the result of an infection of the stomach caused by the bacterium Helicobacter pylori.
Robin Warren (born 1937), a pathologist from Perth, Australia, observed small curved bacteria colonizing the lower part of the stomach (antrum) in about 50% of patients from which biopsies had been taken. He made the crucial observation that signs of inflammation were always present in the gastric mucosa close to where the bacteria were seen.
Barry Marshall (born 1951), a young clinical fellow, became interested in Warren’s findings and together they initiated a study of biopsies from 100 patients. After several attempts, Marshall succeeded in cultivating a hitherto unknown bacterial species (later denoted Helicobacter pylori) from several of these biopsies. Together they found that the organism was present in almost all patients with gastric inflammation, duodenal ulcer or gastric ulcer. Based on these results, they proposed that Helicobacter pylori is involved in the aetiology of these diseases.
Even though peptic ulcers could be healed by inhibiting gastric acid production, they frequently relapsed, since bacteria and chronic inflammation of the stomach remained. In treatment studies, Marshall and Warren as well as others showed that patients could be cured from their peptic ulcer disease only when the bacteria were eradicated from the stomach. Thanks to the pioneering discovery by Marshall and Warren, peptic ulcer disease is no longer a chronic, frequently disabling condition, but a disease that can be cured by a short regimen of antibiotics and acid secretion inhibitors.
This year’s Nobel Prize in Physiology or Medicine goes to Barry Marshall and Robin Warren, who with tenacity and a prepared mind challenged prevailing dogmas. By using technologies generally available (fibre endoscopy, silver staining of histological sections and culture techniques for microaerophilic bacteria), they made an irrefutable case that the bacterium Helicobacter pylori is causing disease. By culturing the bacteria they made them amenable to scientific study.
In 1982, when this bacterium was discovered by Marshall and Warren, stress and lifestyle were considered the major causes of peptic ulcer disease. It is now firmly established that Helicobacter pylori causes more than 90% of duodenal ulcers and up to 80% of gastric ulcers. The link between Helicobacter pylori infection and subsequent gastritis and peptic ulcer disease has been established through studies of human volunteers, antibiotic treatment studies and epidemiological studies.
Helicobacter pylori is a spiral-shaped Gram-negative bacterium that colonizes the stomach in about 50% of all humans. In countries with high socio-economic standards infection is considerably less common than in developing countries where virtually everyone may be infected.
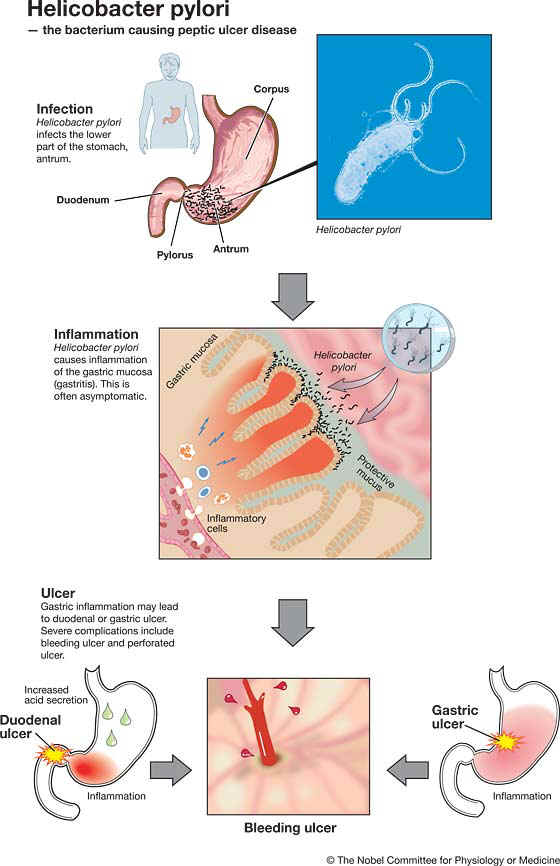
Infection is typically contracted in early childhood, frequently by transmission from mother to child, and the bacteria may remain in the stomach for the rest of the person’s life. This chronic infection is initiated in the lower part of the stomach (antrum). As first reported by Robin Warren, the presence of Helicobacter pylori is always associated with an inflammation of the underlying gastric mucosa as evidenced by an infiltration of inflammatory cells.
The severity of this inflammation and its location in the stomach is of crucial importance for the diseases that can result from Helicobacter pylori infection. In most individuals Helicobacter pylori infection is asymptomatic. However, about 10-15% of infected individuals will some time experience peptic ulcer disease. Such ulcers are more common in the duodenum than in the stomach itself. Severe complications include bleeding and perforation.
The current view is that the chronic inflammation in the distal part of the stomach caused by Helicobacter pylori infection results in an increased acid production from the non-infected upper corpus region of the stomach. This will predispose for ulcer development in the more vulnerable duodenum.
In some individuals Helicobacter pylori also infects the corpus region of the stomach. This results in a more widespread inflammation that predisposes not only to ulcer in the corpus region, but also to stomach cancer. This cancer has decreased in incidence in many countries during the last half-century but still ranks as number two in the world in terms of cancer deaths.
Inflammation in the stomach mucosa is also a risk factor for a special type of lymphatic neoplasm in the stomach, MALT (mucosa associated lymphoid tissue) lymphoma. Since such lymphomas may regress when Helicobacter pylori is eradicated by antibiotics, the bacterium plays an important role in perpetuating this tumour.
Helicobacter pylori is present only in humans and has adapted to the stomach environment. Only a minority of infected individuals develop stomach disease. After Marshall’s and Warren’s discovery, research has been intense. Details underlying the exact pathogenetic mechanisms are continuously being unravelled.
The bacterium itself is extremely variable, and strains differ markedly in many aspects, such as adherence to the gastric mucosa and ability to provoke inflammation. Even in a single infected individual all bacteria are not identical, and during the course of chronic infection bacteria adapt to the changing conditions in the stomach with time.
Likewise, genetic variations among humans may affect their susceptibility to Helicobacter pylori. Not until recently has an animal model been established, the Mongolian gerbil. In this animal, studies of peptic ulcer disease and malignant transformation promise to give more detailed information on disease mechanisms.
Helicobacter pylori infection can be diagnosed by antibody tests, by identifying the organism in biopsies taken during endoscopy, or by the non-invasive breath test that identifies bacterial production of an enzyme in the stomach.
An indiscriminate use of antibiotics to eradicate Helicobacter pylori also from healthy carriers would lead to severe problems with bacterial resistance against these important drugs. Therefore, treatment against Helicobacter pylori should be used restrictively in patients without documented gastric or duodenal ulcer disease.
Many diseases in humans such as Crohn’s disease, ulcerative colitis, rheumatoid arthritis and atherosclerosis are due to chronic inflammation. The discovery that one of the most common diseases of mankind, peptic ulcer disease, has a microbial cause, has stimulated the search for microbes as possible causes of other chronic inflammatory conditions.
Even though no definite answers are at hand, recent data clearly suggest that a dysfunction in the recognition of microbial products by the human immune system can result in disease development. The discovery of Helicobacter pylori has led to an increased understanding of the connection between chronic infection, inflammation and cancer.
 |
Source: http://nobelprize.org/nobel_prizes/medicine/laureates/2005/press.html
Examples of Graphs
LINE GRAPHS

A line graph is most useful in displaying data or information that changes continuously over time. The example below shows the changes in the temperature over a week in January. Notice that the title of the graph is “Average Daily Temperature for January 1-7 in degrees Fahrenheit”.
To the left is a table that shows the date in one column and the corresponding temperature in the second column. The line graph on the right shows the degrees of temperature going up the vertical axis (up and down numbers on the left of the graph) and the days of the week on the horizontal axis (going sideways from left to right). The points for the temperature for each day are connected by a line – thus the graph is a line graph.
|
Average Daily Temperature for January 1-7 in Degrees Fahrenheit
|
 |

BAR GRAPHS
Bar graphs are an excellent way to show results that are one time, that aren’t continuous – especially samplings such as surveys, inventories, etc. Below is a typical survey asking students about their favorite after school activity. Notice that in this graph each column is labeled – it is also possible to label the category to the left of the bar. In this case, the numbers for each category are across the bottom of the chart.
A bar chart is marked off with a series of lines called grid lines. These lines typically mark off a numerical point in the series of numbers on the axis or line. In this case, each grid line going up and down marks a multiple of 20 as the graph is divided. More gridlines can make it easier to be exact with the amounts being shown on the bar graph, but too many can make it confusing. Notice that for data that does not fall evenly on a multiple of 20, the bar is in between two grid lines. Bar graphs are useful to get an overall idea of trends in responses – which categories get many versus few responses.
|
Favorite Student After School Activity
|
 |

CIRCLE/PIE GRAPHS
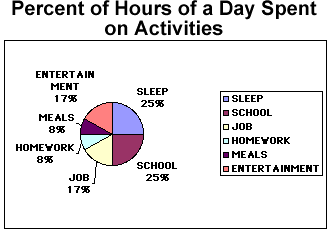
Circle or pie graphs are particularly good illustrations when considering how many parts of a whole are inception. In the table below both the number of hours in a whole day devoted to certain activities is listed as well as the percent of time for each of these activities. The pie chart is then divided very much as a baker’s pie would be into slices that represent the proportional amounts of time spent on each activity.
To the right of the pie chart is a legend that tells which color stands for which category. In addition, the percents are also near the pie slice that stands for that particular amount of time spent.
Percent of Hours of a Day Spent on Activities
| ACTIVITY | HOURS | PERCENT OF DAY |
| Sleep | 6 | 25 |
| School | 6 | 25 |
| Job | 4 | 17 |
| Entertainment | 4 | 17 |
| Meals | 2 | 8 |
| Homework | 2 | 8 |