Egg Osmosis Sample 2 lab


Osmosis through the Cell Membrane of an Egg


Introduction:
Transport can be either passive or active. Passive transport is the movement of substances across the membrane without any input of energy by the cell. Active transport is the movement of materials where a cell is required to expend energy. In the case of this lab the discussion will be centered on passive transport.
The simplest type of passive transport is diffusion. Diffusion is the movement of molecules from an area of higher to an area of lower concentration without any energy input. Diffusion is driven by the kinetic energy found in the molecules. Diffusion will eventually cause the concentration of molecules to be the same throughout the space the molecules occupy, causing a state of equilibrium to exist.
Another type of passive transport is that of osmosis. Osmosis is the movement of water across a semi-permeable membrane. The process by which osmosis occurs is when water molecules diffuse across a cell membrane from an area of higher concentration to an area of lower concentration. The direction of osmosis depends on the relative concentration of the solutes on the two sides. In osmosis, water can travel in three different ways.
If the molecules outside the cell are lower than the concentration in the cytosol, the solution is said to be hypotonic to the cytosol, in this process, water diffuses into the cell until equilibrium is established. If the molecules outside the cell are higher than the concentration in the cytosol, the solution is said to be hypertonic to the cytosol, in this process, water diffuses out of the cell until equilibrium exists. If the molecules outside and inside the cell are equal, the solution is said to be isotonic to the cytosol, in this process, water diffuses into and out of the cell at equal rates, causing no net movement of water.
In osmosis the cell is selectively permeable, meaning that it only allows certain substances to be transferred into and out of the cell. In osmosis, the proteins only on the surface are called peripheral proteins, which form carbohydrate chains whose purpose is used like antennae for communication. Embedded in the peripheral proteins are integral proteins that can either be solid or have a pore called channel proteins. Channel proteins allow glucose, or food that all living things need to live, pass through.


Hypothesis:
In the syrup solution, there will be a net movement of molecules out of the egg, and in the water solution, the molecules will diffuse in and out of the cell at equal rates.


Materials:
The materials used in this lab were 2 fresh eggs in the shell, an overhead marker, 400 ml of water, graduated cylinder, 1 large beaker, 2 medium beakers, 1 small beaker, white vinegar, Karo syrup, distilled water, pencil, paper, lab apron, lab goggles, saran wrap, masking tape, plastic tray, tongs, electronic balance, osmosis lab sheet, and computer.


Methods:
On day 1, measure the masses of both the eggs with the shell. Label 1 beaker vinegar, and then use the graduated cylinder to measure 400 mL of vinegar to put in the labeled beaker. Place both eggs in the solution (place a small beaker on top of the eggs, if necessary) then cover. Let the eggs stand for 24 hours or more to remove the shell.


On day 2, record the observations of what happened to the eggs in the vinegar solution. Carefully, remove the eggs from the vinegar, gently rinsing the eggs off in water. Clean the beakers used for the vinegar solution preparing them for the syrup solution, and then label the 2 medium beakers syrup. Before the eggs are placed in the syrup solution record the mass of both eggs then put it on the datasheet. After that has been done, place the eggs in the beaker, pouring enough syrup to cover the eggs, cover them loosely and let them stand for 24 hours.

On day 3, record the observations of the egg from the syrup solution. Carefully, remove the eggs from the beakers, gently rinsing the syrup off of the eggs. Pour the remaining syrup in the container provided by the teacher. Clean the two beakers used in the syrup solution, preparing them for the water solution. Before the eggs are placed in the water solution record the mass of both eggs then put it on the datasheet. After that has been done, using a graduated cylinder, measure out 200 mL of water for each beaker. Place the eggs in the water solution, cover and let stand 24 hours.

On day 4, record the observations of the egg from the water solution. Carefully remove the eggs from the beakers, gently rinsing them off. Mass both of the eggs. After the teacher has came and looked at the eggs, discard in the proper place.


Results:


Isotonic Solution Hypotonic (Vinegar is acid in Water)
Hypertonic


Table 1- Egg 1 Data


Egg mass before added into the solution (g)


Egg mass after added into the solution (g)


Observations


Vinegar

70.8 g (with shell) 98.0 g (without shell) Before the egg was added into the vinegar, it was large, but the after effect was that the egg increased in size and had become hard. After two days, the shell was completely removed.
 

Syrup

98.0 g 65.0 g When the egg was removed from the syrup, it had shrunk and it was softer than before it was added into the solution
 

Water

65.0 g 105.3 g When the egg was removed out of the water, the color looked of a pale yellow. The water had diffused into the egg, because the egg was larger in size before it was added into the water.


Table 2- Egg 2 Data


Egg mass before added into the solution (g)


Egg mass after added into the solution (g)


Observations


Vinegar

71.6 g (with shell) 99.1 g (without shell) Egg 2s’ mass was greater than egg 1s’ mass before and after it was added into the vinegar solution. The mass had increased some 20 grams with the shell off.
 

Syrup

99.1 g 64.0 g The mass of the egg had decreased some 30 grams after it the egg was removed from the syrup solution. The mass of the egg 2 was smaller than the mass of egg1.
 

Water

64.0 g 105.2 g The mass of egg 2 had increased some 50 grams after being added into the water solution. The mass of egg 1, though, was larger than the mass of 2 by 1 gram. If the egg would have remained in the water a little while longer, the egg would have probably went through cytolysis.


1. When the egg was placed in the water in which direction did the water molecules move?     The water molecules moved in the egg.

2. On what evidence do you base this? The molecules moved in, because the size of the egg increased

3. How do you explain the volume of liquid remaining when the egg was removed from the syrup? Since, the cell is selectively permeable, it only allowed a certain amount of the syrup to be present in the cell, just enough to shrink it and also equilibrium was reached..

4. When the egg was placed in the water after being removed from the syrup in which direction did the water move? The water moved in.

5. Why did the water molecules travel better inside the cell than the syrup molecules? The water molecules traveled better into the cell because smaller molecules travel better than other larger molecules.

6. What was the purpose of placing the egg in vinegar? The  vinegar solution was only used to remove the shell off the egg.

Error Analysis:
A possible error in this lab occurred by having to leave the egg in vinegar for two days instead of one to remove the shell. This caused the egg to initially take in more water.


Discussion and Conclusion:
Based on the data collected and the results of the experiment, the hypothesis was  correct. The egg appeared shriveled after removing it from the syrup because of the movement of water out of the egg. The syrup solution was hypertonic so water moved out of the egg from an area where water was more concentrated to the outside of the egg where water was less concentrated due to the high amount of sugar or solute. The acetic acid in vinegar did remove the shell from the egg, because the egg required two days to completely remove the shell, some water did move into the egg causing its initial mass without the shell to be higher than the egg’s mass with its shell. Whenever the egg was transferred from the syrup to the distilled water, the concentration of water outside the shriveled egg was greater than the water concentration inside the egg; therefore, water moved into the egg until equilibrium was reached. At that point, movement into and out of the egg continued with no net movement of water molecules.
Additional research  to see if the egg would have went through cytolysis in another 24 or more hours in the water solution would have been interesting.

BACK

DNA Model


Structure of DNA Lab


Introduction:

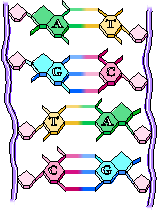
Deoxyribonucleic acid (DNA) is one of the two types of nucleic acids found in organisms and viruses. The structure of DNA determines which proteins particular cells will make. The general structure of DNA was determined in 1953 by James Watson and Francis Crick. The model of DNA that they constructed was made of two chains now referred to as the double helix. Each chain consists of linked deoxyribose sugars and phosphates units. The chains are complementary to each other. One of four nitrogen-containing bases connects the chains together like the rungs of a ladder. The bases are cytosine, guanine, thymine, and adenine. The DNA molecule looks like a spiral staircase. The structure of DNA is illustrated by a right handed double helix, with about 10 nucleotide pairs per helical turn.

DNA is a polymer. The monomer units of DNA are nucleotides. Each nucleotide consists of a 5-carbon sugar (deoxyribose), a nitrogen containing base attached to the sugar, and a phosphate group. (See Table 1.) There are four different types of nucleotides found in DNA, differing only in the nitrogenous base. Adenine and guanine are purines. Purines are the larger of the two types of bases found in DNA. They have two rings of carbons & nitrogens. Cytosine and thymine are pyrimidines and have a single carbon-nitrogen ring. (See Table 2.) The sequence of these bases encodes hereditary instructions for making proteins—which are long chains of amino acids. These proteins help build an organism, act as enzymes, and do much of the work inside cells.

Table 1


DNA Nucleotide
(Sugar + Phosphate + Base)


 Table 2


Pyrimidine
(single ring of C & N)
Purine
(double ring of C & N)


Materials:

Colored paper (any 5 different colors to run templates), scissors, transparent tape, coat hanger, hole punch, string or fishing line

Procedure:

  1. Use the section of DNA you have been assigned (Human hemoglobin or Chicken Hemoglobin), and figure out the sequence of bases present on the complementary strand of this molecule Table 1.


Human Hemoglobin Chicken Hemoglobin
Left Strand Complementary Strand Left Strand Complementary Strand
TAA GTT
TGT TGT
CGA CCG
CCG CCG
CTG CGA
GTC GTC
CAA TAT
GTC CGA
CTT TTG
TGA AGG


  1. Count the number of bases (A, T, C, and G) you will need for both strands of the DNA model your group has been assigned, and cut out these bases. (60 total)
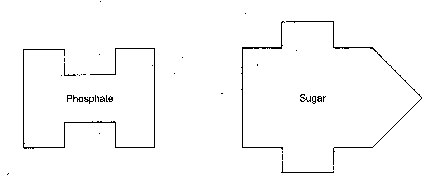
  2. Cut out a sugar and a phosphate for each of your DNA bases. (120 of each)
  3. Construct a nucleotide for each base that you have cut (sugar + phosphate + base) by taping these together. (20 total nucleotides)
  4. Using your assigned DNA sequence from Table 1, line up the nucleotides in the right order forming he left strand of your DNA molecule. (30 nucleotides)
  5. Add the other complementary nucleotides to form the right strand by taping the bases together (A bonds with T; C bonds with G).
  6. Once the strand is complete, secure it by adding more transparent tape or ask your teacher to laminate your model.
  7. Punch two holes at the top of your model, and attach the DNA model to a coat hanger with string.
  8. Carefully twist your model into a double helix (5 base pairs in a 1/2 turn and 10 in a complete turn).
  9. Attach thin fishing line to the sides of the nucleotides to hold the turns in place.
  10. Hang your model from the ceiling using the top of your coat hanger.

TEMPLATES:

Questions & Observations:

1. What 2 molecules make up the sides of the DNA molecule?

2. What nitrogen bases form the rungs of the DNA double helix?

3. What is meant by the complementary strand of DNA?


4. What sugar makes up DNA nucleotides?

5. How are nucleotides named?


6. DNA is the instructions for building what molecule in our cells?

7. What would happen if one or more bases on the DNA strand were changed?


Energy in food


The Heat is On – The Energy Stored in Food
Introduction:

Plants utilize sunlight during photosynthesis to convert carbon dioxide and water into glucose (sugar) and oxygen. This glucose has energy stored in its chemical bonds that can be used by other organisms. This stored energy is released whenever these chemical bonds are broken in metabolic processes such as cellular respiration.

Cellular respiration is the process by which the chemical energy of “food” molecules is released and partially captured in the form of ATP. Cellular respiration is the general term which describes all metabolic reactions involved in the formation of usable energy from the breakdown of nutrients. In living organisms, the “universal” source of energy is adenosine triphosphate (ATP). Carbohydrates, fats, and proteins can all be used as fuels in cellular respiration, but glucose is most commonly used as an example to examine the reactions and pathways involved.

Marathon runners eat a large plate of pasta the night before a competition because pasta is a good source of energy, or fuel for the body. All foods contain energy, but the amount of potential energy stored will vary greatly depending on the type of food. Moreover, not all of the stored energy is available to do work. When we eat food, our bodies convert the stored energy, known as Calories, to chemical energy, thereby allowing us to do work. A calorie is the amount of heat (energy) required to raise the temperature of 1 gram (g) of water 1 degree Celsius (°C). The density of water is 1 gram per milliliter (1g/ml) therefore 1 g of water is equal to 1 ml of water. When we talk about caloric values of food, we refer to them as Calories (notice the capital “C”), which are actually kilocalories. There are 1000 calories in a kilocalorie. So in reality, a food item that is listed as having 38 Calories has 38,000 calories. Calories are a way to measure the energy you get from the food you eat.

Just as pasta can provide a runner energy to run a marathon, a tiny peanut contains stored energy that can be used to heat a container of water. For this lab exercise, you will indirectly measure the amount of Calories in couple of food items using a calorimeter. A calorimeter (calor = Latin for heat) is a device that measures the heat generated by a chemical reaction, change of state, or formation of a solution. There are several types of calorimeters but the main emphasis of all calorimeters is to insulate the reaction to prevent heat loss. We will be using a homemade calorimeter modeled after a constant-volume calorimeter. A particular food item will be ignited, the homemade calorimeter will trap the heat of the burning food, and the water above will absorb the heat, thereby causing the temperature (T) of the water to increase. By measuring the change in temperature (∆T) of a known volume of water, you will be able to calculate the amount of energy in the food tested


Objective:


In this experiment, you will measure the amount of energy available for use from three types of nuts, a plant product. This process of measuring the energy stored in food is known as calorimetry.

Materials:
large paper clip, oC thermometer, soft drink can, soft drink can with openings cut into the side, mixed nuts, matches, water, electronic balance, pencil & paper, 100 ml graduated cylinder, calculator

Procedure:

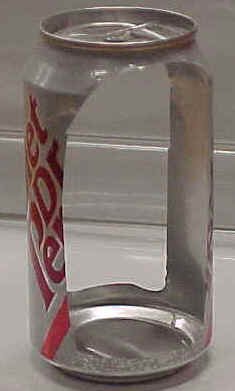
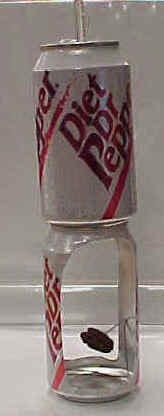
  1. Carefully, cut out two openings along the side of a soft drink can. This will serve as your support for the second drink can that will contain water & sit on top.

  1. Bend a large size paper clip so that a nut can be attached on one end and the other end will sit flat inside the cut-out soft drink can.


  1. Use the graduated cylinder to accurately measure 100g (100ml) of water. Pour this water into the uncut soft drink can.
  2. Place the thermometer in the uncut can and measure the water temperature after 3 minutes.  Record this temperature on  data table 1.

  1. Mass the nut (g) that you will burn and record this mass on  data table 1.
  2. Attach the nut to the bent end of your paper clip and carefully set the clip & nut into the cut-out soft drink can on bottom. Make sure the cans are sitting on a flat, nonflammable surface!

  1. Carefully light the nut from the bottom using a match and record the change in water temperature as the nut burns (thermometer in the can during burning). Immediately after the nut finishes burning, record the final (highest) water temperature on data table 1.
  2. Measure the mass (g) of the remaining nut & record this in the data table 1. (Mass the burned nut and paper clip together and then subtract the mass of the nut to get the mass of the nut alone.)
  3. Complete the data table1 by calculating the change in mass of the nut.
  4. Repeat this experiment with the other two types of nuts .
  5. When all three nuts have been burned, complete the analysis on data table 2.

Results:


Table 1 – Results of Burning

PECAN WALNUT ALMOND
oC  H2O temperature Before burning
oC
 
oC  H2O temperature After burning
oC
Difference in oC H2O temperature
oC
Mass of Paper Clip
g
Mass of Nut Before Burning
Mass of Paper Clip and Nut After Burning
g
Mass of Nut ALONE After Burning
(Subtract paper clip mass from mass of nut & paper clip after burning)
g
(Subtract paper clip mass from mass of nut & paper clip after burning)
g


Table 2 – Data Analysis from Nut Calorimetry

PECAN WALNUT ALMOND
Mass Difference of Nut Before & After Burning

(Subtract mass of nut after burning from Mass of nut before burning)
g

Temperature Difference of H2O Before & After Burning
(Subtract original water temp. from final water temp.)
oC
Calories Required to Change the Temperature of 100 g of H2O
(Multiply temperature change by 100)Cal
Average Calories per gram in the Nut
(Divide the total calories by the mass difference of the nut before & after burning)Cal/g
Average kilocalories or food calories per gram
(Divide the calories per gram by 1000)kcal/g


Questions & Conclusion:

  1. Where did the energy stored in the nut originally come from?
  2. During what process was this energy stored in the nut, & where specifically was it stored?
  3. What simple sugar made by plants is a common source for stored energy?
  4. Which group of macromolecules would a nut contain — carbohydrates, lipids, or protein?
  5. What is the name for stored energy?
  6. Give some examples of how organisms would use this stored energy.
  7. In this experiment, discuss what happened to the energy stored in the nut.
  8. Why was the final mass of the nut less than the original mass of the nut? (Remember that matter can’t be destroyed in a chemical reaction.)


BACK

Diffusion and Osmosis


  Diffusion and Osmosis

Introduction:
In this exercise you will measure diffusion of small molecules through dialysis tubing, an example of a semi permeable membrane. The movement of a solute through a semi permeable membrane is called dialysis. The size of the minute pores in the dialysis tubing determines which substance can pass through the membrane. A solution of glucose and starch will be placed inside a bag of dialysis tubing. Distilled water will be placed in a beaker, outside the dialysis bag. After 30 minutes have passed, the solution inside the dialysis tubing and the solution in the beaker will be tested for glucose and starch. The presence of reducing sugars like glucose, fructose, and sucrose will be tested with Benedict’s Solution. The presence of starch will be tested with Lugol’s solution (iodine-potassium-iodide).

Procedure:

  1. Obtain a 30 -cm piece of 2.5-cm dialysis tubing that has been soaking in water. Tie off one end of the tubing to form a bag. To open the other end of the bag, rub the end between your fingers until the edges separate.
  2. Place 15 mL of the 15% glucose/ 1% starch solution in the bag. Tie off the other end of the bag, leaving sufficient space for the expansion of the bag’s contents. Record the color of the solution in Table 1.1.
  3. Test the 15% glucose / 1% starch solution in the bag for the presence of glucose. Your teacher may have you do a Benedict’s test. Record the results in Table1.1.
  4. Fill a 250 mL beaker or cup 2/3 full with distilled water. Add approximately 4 mL of Lugol’s solution to the distilled water and record the color in Table 1.1. Test the solution for glucose and record the results in Table 1.1.
  5. Immerse the bag in the beaker of solution.
  6. Allow your set up to stand for approximately 30 minutes or you see a distinct color change in the bag or the beaker. Record the final color of the solution in the bag, and of the solution in the beaker, in Table 1.1.
  7. Test the liquid in the beaker and in the bag for the presence of glucose. Record the results in Table 1.1.


Table 1.1

Initial Contents Initial Solution Color Final Solution Color Initial Presence of Glucose Final Presence of Glucose
Bag 15% Glucose & 1% starch
Beaker H2O + IKI

Analysis of Results:
1. Which substance(s) are entering the bag and which are leaving the bag? What experimental evidence supports your answer?

_______________________________________________________________________

_______________________________________________________________________

_______________________________________________________________________

_______________________________________________________________________

2. Explain the results you obtained. Include the concentration differences and membrane pore size in your discussion.

________________________________________________________________________

________________________________________________________________________

________________________________________________________________________

________________________________________________________________________

3. Quantitative data uses numbers to measure observed changes. How could this experiment be modified so that quantitative data could be collected to show that water diffused into the dialysis bag?

________________________________________________________________________

________________________________________________________________________

________________________________________________________________________

________________________________________________________________________

________________________________________________________________________

4. Based on your observations, rank the following by relative size, beginning with the smallest : glucose molecules, water molecules, IKI molecules, membrane pores, starch molecules.

_______________________________________________________________________

_______________________________________________________________________

5. What results would you expect if the experiment started with glucose and IKI solution inside the bag and only starch and water outside? Why?

________________________________________________________________________

________________________________________________________________________

________________________________________________________________________

________________________________________________________________________

Osmosis:
In this experiment you will use dialysis tubing to investigate the relationship between solute concentration and the movement of water through a semi permeable membrane by the process of osmosis. When two solutions have the same concentration of solutes, they are said to be isotonic to each other. If the two solutions are separated by a semi permeable membrane, water will move between the two solutions, but there will be no net change in the amount of water in either solution. If two solutions differ in the concentration of solutes that each has, the one with more solute hypertonic to the one with the less solute. The solution that has less solute is hypotonic to the one with more solute. These words can only be used to compare solutions.

Procedure:
1. Obtain six 30-cm strips of presoaked dialysis tubing.

2. Tie a knot in one end of each piece of dialysis tubing to form six bags. Pour approximately 25 mL of each of the following solutions into separate bags:

  • Distilled water
  • 0.2 M sucrose
  • 0.4 M sucrose
  • 0.6 M sucrose
  • 0.8 M sucrose
  • 1.0 m sucrose

Remove most of the air from the bags by drawing the dialysis bag between two fingers. Tie off the other end of the bag. Leave sufficient space for the expansion of the contents in the bag.

3. Rinse each bag gently with distilled water to remove any sucrose spilled during filling.

4. Carefully blot the outside of each bag and record in Table 1.2 the initial mass of each bag.

5. Fill six 250 mL beakers 2/3 full with distilled water.

6. Immerse each bag in one of the beakers of distilled water and label the beaker to indicate the molarity of the solution in the dialysis bag. Be sure to completely submerge each bag.

7. Let them stand for 30 minutes.

8. At the end of 30 minutes remove the bags from the water. Carefully blot and determine the mass of each bag.

9. Record your group’s results in Table 1.2. Obtain data from the other lab groups in your class to complete Table 1.3: Class Data.

Table 1.2 Dialysis Bag Results: Individual Data

Contents in Dialysis Bag Initial Mass Final Mass Mass Difference % Change in Mass
a). Distilled Water  


b). 0.2 M  


c). 0.4 M  


d). 0.6 M  


e). 0.8 M  


f). 1.0 M  


To Calculate:

% change in mass = Final Mass-Initial Mass X 100
———————–

Initial Mass

Table 1.3 Dialysis Bag Results: Class Data

percent change in Mass of Dialysis Bags


Bag Contents Group 1 Group 2 Group 3 Group 4 Group 5 Group 6 Total Class Average
Distilled Water
0.2 M
0.4 M
0.6 m
0.8 M
1.0 M

10. Graph the results for both your individual data and class average on the following graph. For this graph you will need to determine the following:

a). the independent variable. __________________________________

b). the dependent variable. ___________________________________

Graph Title ______________________________________________

Analysis of Results:
1. Explain the relationship between the change in mass and the molarity of sucrose within the dialysis bag.

________________________________________________________________________

________________________________________________________________________

________________________________________________________________________

________________________________________________________________________

________________________________________________________________________

2. Predict what would happen to the mass of each bag in this experiment if all the bags were placed in a 0.4 M sucrose solution instead of distilled water. Explain your response.

________________________________________________________________________

________________________________________________________________________

________________________________________________________________________

________________________________________________________________________

________________________________________________________________________

3. Why did you calculate the per cent change in mass rather than using the change in mass?

________________________________________________________________________

________________________________________________________________________

________________________________________________________________________

________________________________________________________________________

________________________________________________________________________

4. A dialysis bag is filled with distilled water and then placed in a sucrose solution. The bag’s initial mass is 20 g. and its final mass is 18 g. Calculate the percent change of mass, showing your calculations in the space below.


5. The sucrose solution in the beaker would have been ___________________ to the distilled water in the bag.