AP Lecture Guide HGP

HUMAN GENOME PROJECT
INSIGHTS LEARNED FROM THE SEQUENCE

What has been learned from analysis of the working draft sequence of the human genome? What is still unknown?

By the Numbers

• The human genome contains 3164.7 million chemical nucleotide bases (A, C, T, and G).

• The average gene consists of 3000 bases, but sizes vary greatly, with the largest known human gene being dystrophin at 2.4 million bases.

• The total number of genes is estimated at 30,000 to 35,000, much lower than previous estimates of 80,000 to 140,000 that had been based on extrapolations from gene-rich areas as opposed to a composite of gene-rich and gene-poor areas.

• The order of almost all (99.9%) nucleotide bases are exactly the same in all people.

• The functions are unknown for over 50% of discovered genes.

The Wheat from the Chaff

• Less than 2% of the genome encodes for the production of proteins.

• Repeated sequences that do not code for proteins (“junk DNA”) make up at least 50% of the human genome.

• Repetitive sequences are thought to have no direct functions, but they shed light on chromosome structure and dynamics. Over time, these repeats reshape the genome by rearranging it, thereby creating entirely new genes or modifying and reshuffling existing genes.

• During the past 50 million years, a dramatic decrease seems to have occurred in the rate of accumulation of repeats in the human genome.

How It’s Arranged

• The human genome’s gene-dense “urban centers” are predominantly composed of the DNA building blocks G and C.

• In contrast, the gene-poor “deserts” are rich in the DNA building blocks A and T. GC- and AT-rich regions usually can be seen through a microscope as light and dark bands on chromosomes.

• Genes appear to be concentrated in random areas along the genome, with vast expanses of noncoding DNA between.

• Stretches of up to 30,000 C and G bases repeating over and over often occur adjacent to gene-rich areas, forming a barrier between the genes and the “junk DNA.” These CpG islands are believed to help regulate gene activity.

• Chromosome 1 has the most genes (2968), and the Y chromosome has the fewest (231).

How the Human Genome Compares with That of Other Organisms

• Unlike the human’s seemingly random distribution of gene-rich areas, many other organisms’ genomes are more uniform, with genes evenly spaced throughout.

• Humans have on average three times as many kinds of proteins as the fly or worm because of mRNA transcript “alternative splicing” and chemical modifications to the proteins. This process can yield different protein products from the same gene.

• Humans share most of the same protein families with worms, flies, and plants, but the number of gene family members has expanded in humans, especially in proteins involved in development and immunity.

• The human genome has a much greater portion (50%) of repeat sequences than the mustard weed (11%), the worm (7%), and the fly (3%).

• Although humans appear to have stopped accumulating repeated DNA over 50 million years ago, there seems to be no such decline in rodents. This may account for some of the fundamental differences between hominids and rodents, although gene estimates are similar in these species. Scientists have proposed many theories to explain evolutionary contrasts between humans and other organisms, including those of life span, litter sizes, inbreeding, and genetic drift.

Variations and Mutations

• Scientists have identified about 1.4 million locations where single-base DNA differences (SNPs) occur in humans. This information promises to revolutionize the processes of finding chromosomal locations for disease-associated sequences and tracing human history.

• The ratio of germline (sperm or egg cell) mutations is 2:1 in males vs females. Researchers point to several reasons for the higher mutation rate in the male germline, including the greater number of cell divisions required for sperm formation than for eggs.

What We Still Don’t Know: A Checklist for Future Research

• Exact gene number, exact locations, and functions

• Gene regulation

• DNA sequence organization

• Chromosomal structure and organization

• Noncoding DNA types, amount, distribution, information content, and functions

• Coordination of gene expression, protein synthesis, and post-translational events

• Interaction of proteins in complex molecular machines

• Predicted vs experimentally determined gene function

• Evolutionary conservation among organisms

• Protein conservation (structure and function)

• Proteomes (total protein content and function) in organisms

• Correlation of SNPs (single-base DNA variations among individuals) with health and disease

• Disease-susceptibility prediction based on gene sequence variation

• Genes involved in complex traits and multigene diseases

• Complex systems biology, including microbial consortia useful for environmental restoration

• Developmental genetics, genomics

http://genome.gsc.riken.go.jp/hgmis/project/journals/insights.html

AP Lecture Guide 10 – Photosynthesis


AP Biology: Chapter 10


PHOTOSYNTHESIS


1. What role do autotrophs fill in the biosphere?

__________________________________________________________________________

2. Indicate the role of each structure within the leaf:

a. stomates _______________________________________________________________

b. mesophyll cells __________________________________________________________

c. thylakoid membranes _____________________________________________________

d. stroma _________________________________________________________________

3. What is the source of oxygen released from photosynthesis?

__________________________________________________________________________

4. In the overview of photosynthesis, indicate the most significant function of:

a. Light reaction ___________________________________________________________

b. Calvin cycle ____________________________________________________________

5. Light is a form of energy known as _____________________________________________

and visible light has a wavelength range of _______________________________________ .

6. Plant light receptors absorb _________________________________________ wavelengths

of light and reflect ___________________________________________wavelengths of light.

7. The porphyrin ring of chlorophyll contains the element ______________________________

and the role of the ring is to ___________________________________________________

__________________________________________________________________________

8. What does chlorophyll do when excited by photons? _______________________________

__________________________________________________________________________

9. Label the diagram and explain the difference between Photosystem I and Photosystem II.

__________________________________________________________________________

__________________________________________________________________________

__________________________________________________________________________

10. With 2 different colored pencils, follow the energy paths of both noncyclic and cyclic electron

flow in the diagram.

11. How does cyclic differ from noncyclic photophosphorylation?

__________________________________________________________________________

__________________________________________________________________________

12. To generate ATP, chloroplasts rely on the ETC to _________________________________

and ATP is synthesized when: _________________________________________________

__________________________________________________________________________

13. Within the thylakoid membrane and stroma, indicate what happens to each of the following:

a. water __________________________________________________________________

b. high energy electrons _____________________________________________________

c. H+ ____________________________________________________________________

d. oxygen ________________________________________________________________

e. NADP+ ________________________________________________________________

f. ADP __________________________________________________________________

14. Where in the chloroplast is the H+ concentration highest? ___________________________

__________________________________________________________________________

15. What happens during carbon fixation? __________________________________________

__________________________________________________________________________

__________________________________________________________________________

16. List the materials the plant uses during the Calvin cycle and the source of the materials.

__________________________________________________________________________

__________________________________________________________________________

17. The products of the Calvin cycle are ____________________________________________

__________________________________________________________________________

18. What environmental and internal challenges have forced both C4 and CAM plants to evolve

alternatives to the photosynthesis system used by other plants?

__________________________________________________________________________

__________________________________________________________________________

19. Why do high oxygen levels inhibit photosynthesis? ________________________________

__________________________________________________________________________

20. What happens during photorespiration and why is it considered bad for plants?

__________________________________________________________________________

__________________________________________________________________________

21. What evolutionary adaptations to the Calvin cycle are seen in C4 plants like sugar cane?

__________________________________________________________________________

__________________________________________________________________________

__________________________________________________________________________

22. Draw a diagram to show the anatomical adaptations seen in C4 plants to accommodate their variation on the Calvin cycle.


23. What evolutionary adaptation to the Calvin cycle is seen in CAM plants like cacti?

__________________________________________________________________________

__________________________________________________________________________

AP Plant Study Guide-8b


Unit 8B – Plants
Know the following:

  • water potential of a turgid plant cell in pure water
  • adaptations of hydrophytes
  • what occurs if guard & surrounding epidermal cells are K+ deficient
  • how stomata are opened & closed
  • what must the plant expend for bulk flow of water in the root apoplast
  • which part of an oat seedling detects the direction of light
  • effect of gibberellins on the aleurone layer of seeds
  • how plant hormones determine the bending of plants toward light
  • what hormone might produce normal growth in a mutant dwarf plant
  • what can function as a sink in plants
  • why does photosynthesis decrease in wilting leaves
  • what are epiphytes
  • what is chlorosis
  • what soil characteristics would be the least productive to plant growth
  • what happens to most water taken up by a plant
  • how solutes move in plants according to the pressure-flow hypothesis of phloem transport
  • what causes guttation to occur
  • why does most of the water in xylem move upward in a tree
  • what property of water causes cohesion of its molecules
  • function of companion cells
  • what 2 elements make up most of the dry weight of plants
  • what could be the harmful effect of spraying a fungicide on a woodlot
  • what do carnivorous plants supplement by eating insects
  • why is nitrogen fixation so important
  • what would be characteristics of soil well suited for plant growth
  • what is the function of micronutrients in plants
  • what elements are micronutrients needed by plants
  • what elements are macronutrients needed by plants
  • what is meant by double fertilization
  • what are some “vegetables” that technically are fruits
  • why is sexual reproduction an advantage to plants
  • what  is the megaspore mother cell & what does it do
  • what do male gametophytes produce in plants
  • name 4 flower parts that are modified leaves
  • what is the function of a seed’s radicle
  • what forms pollen on a plant
  • what do the 2 sperm nuclei fertilize in plants
  • what causes seed germination
  • what floral parts are involved in pollination & fertilization
  • what things can function in signal transduction in plants
  • what is needed by a short-day plant for it to flower
  • what type of tropism do vines use to grow toward tropical trees
  • why do plants use changes in photoperiods instead of air temperature changes to trigger dormancy
  • what is needed to get poinsettias to bloom  early in December
  • do plant hormones act the same on all root & stem tissues
  • what hormone is involved in the rapid opening & closing of stomata
  • what effect do auxins have on stem cuttings that are to be rooted


AP Lecture Guide 12 – Cell Cycle


AP Biology: CHAPTER 12

CELL CYCLE


1. What is meant by the concept that cells go through a cell cycle?

__________________________________________________________________________

__________________________________________________________________________

2. What are the key roles of cell division?

__________________________________________________________________________

__________________________________________________________________________

3. What is the significance of chromosome replication?

__________________________________________________________________________

__________________________________________________________________________

4. Sketch and label replicated chromosomes.


5. List the phases of the cell cycle with a brief description of what occurs in each phase.

a. _______________________________________________________________________

b. _______________________________________________________________________

c. _______________________________________________________________________

d. _______________________________________________________________________

e. _______________________________________________________________________


6. Label the stages and key features of each stage.

7. How does the spindle apparatus distribute chromosomes to the daughter cells?

__________________________________________________________________________

__________________________________________________________________________

8. What is the role of the kinetochores and the microtubules?

__________________________________________________________________________

__________________________________________________________________________

9. How does cytokinesis differ in animal and plant cells? Label the diagrams below.

__________________________________________________________________________

__________________________________________________________________________

__________________________________________________________________________

10. Eukatyotic mitosis is thought to have evolved from _________________________________

11. Why is the regulation of the cell cycle critical to normal cells?

__________________________________________________________________________

__________________________________________________________________________

12. What is the G1 checkpoint and where does it fit into the cycle?

__________________________________________________________________________

__________________________________________________________________________

13. What evidence is there that regulation is chemical in nature?

__________________________________________________________________________

__________________________________________________________________________

__________________________________________________________________________

14. Identify the role of the following in the cell cycle clock:

a. Kinase _________________________________________________________________

__________________________________________________________________________

b. Cyclin _________________________________________________________________

__________________________________________________________________________

c. CDKs _________________________________________________________________

__________________________________________________________________________

15. Describe the mechanism for regulating the passage of the cell into anaphase.

__________________________________________________________________________

__________________________________________________________________________

16. Describe what triggers mitosis from G2.

__________________________________________________________________________

__________________________________________________________________________

17. What is the role of ubiquitin?

__________________________________________________________________________

__________________________________________________________________________

__________________________________________________________________________

18. Describe a model for an external signal for growth.

__________________________________________________________________________

__________________________________________________________________________

__________________________________________________________________________

19. What happens when cancer develops?

__________________________________________________________________________

__________________________________________________________________________

__________________________________________________________________________

__________________________________________________________________________

20. What is the role of p53?

__________________________________________________________________________

__________________________________________________________________________

__________________________________________________________________________


AP Sample 4 Lab 2 – Enzyme Catalysis


Lab. 2 – Enzyme Catalysis    

Introduction:

This lab will observe the conversion of hydrogen peroxide to water and oxygen gas by the enzyme catalysis. The amount of oxygen generated will be measured and used to calculate the rate of the enzyme-catalized reaction. Enzymes are proteins produced by living cells. Enzymes act as biochemical catalysts during a reaction, meaning they lower the activation energy needed for that reaction to occur. Through enzyme activity, cells gain the ability to carry out complex chemical activities at relatively low temperatures. The substance in an enzyme-catalyzed reaction that is to be acted upon is the substrate, which binds reversibly to the active site of the enzyme. The active site is the portion of the enzyme that interacts with the substrate. One result of this temporary union between the substrate and the active site is a reduction in the activation energy required to start the reaction of the substrate molecule so that products are formed. In a mathematical equation of the substrate (S) binding with the activation site (E) and forming products (P) is:

E + S —> ES –> E + P

Several ways enzyme action may be affected include:

1) Salt Concentration —  For example, if salt concentration is close to zero, the charged amino acid side chains of the enzyme molecules will attract each other. The enzyme will then denature and form an inactive precipitate. If salt concentration is extremely high, the normal interaction of charged groups will be blocked, new interactions will occur, and again the enzyme will precipitate.  An intermediate salt concentration such as that of human blood (0.9%) is the optimum for many enzymes.

2) pH of the environment — . The pH of a solution is a logarithmic scale that measures the acidity or H+ concentration in a solution.  The scale begins at 0, being the highest in acidity, and ends at 14, containing the least amount of acidity. As the pH is lowered an enzyme will tend to gain H+ ions, disrupting the enzyme’s shape. In turn, if the pH is raised, the enzyme will lose H+ ions and eventually lose its active shape.

3) Temperature — Usually, chemical reactions speed up as the temperature is raised. When the temperature is increased, more of the reacting molecules have enough kinetic energy to undergo the reaction. However, if the temperature goes past a temperature optimum, the conformation of the enzyme molecules is disrupted.

4) Activations and Inhibitors — Many molecules other than the substrate may interact with an enzyme. If such a molecule speeds up the reaction it is an activator, but if it slows the reaction down it is an inhibitor.

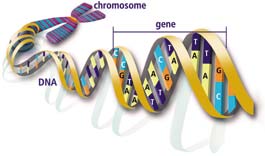
The enzyme used in this lab is catalase, which has four polypeptide chains that are composed of more than 500 amino acids each. One function of this enzyme is to prevent the accumulation of toxic levels of hydrogen peroxide formed as a by-product of metabolic processes. Catalase is also involved in some of the many oxidation reactions that occur in the cells of all living things. The primary reaction catalyzed by catalase is the decomposition of hydrogen peroxide to form water and oxygen.

2H2O2  ——->  2 H2O  +  O2  (gas)

Without the help of catalase, this reaction occurs spontaneously, but very slowly. Catalase helps to speed up the reaction considerably. In this lab, a rate for this reaction will be determined.

Hypothesis:

The enzyme catalase, under optimum salt conditions, temperature, and pH level will speed up the reaction as it denatures the hydrogen peroxide at a higher rate than normal.

Materials:

Exercise 2A

For the first part of the lab, 10 mL of 1.5% H2O2, a 50-mL glass beaker, and 1 mL of fresh catalase are needed. At the second stage a test tube, a hot water bath, 5 mL of catalase, 10 mL of 1.5% H2O2 are needed. Finally, in the third part, a potato, and10 mL of 1.5% H2O2 are needed.

Exercise 2B

For this experiment, 10 mL of 1.5% H2O2, 1 mL of water, 10 mL of sulfuric acid, two 25 mL beakers, 5-10 mL syringe, potassium permanganate, lab aprons and trays are needed.

Exercise 2C

In this section of the experiment, 20 mL of 1.5% H2O2, two glass beakers, 1 mL of H2O, 10 mL of sulfuric acid, a 5 mL syringe, 5-10 mL of potassium permanganate, and lab aprons and trays are used.

Exercise 2D

In the final part of the lab, 6 plastic cups labeled 10, 30, 60, 120, 180, 360, 6 plastic cups labeled acid, 60 mL of 1.5% H2O2, a 50-mL beaker, 6 mL of catalase extract, two 5-mL syringes, potassium permanganate, a timer (clock), lab aprons and trays are needed.

Methods:

Exercise 2A

Transfer 10 mL of 1.5% H2O2 into a 50-mL glass beaker and add 1 mL of freshly made catalase solution. The fresh catalase should be kept on ice until ready to be used. Observe the reaction. Then transfer 5 mL of purified catalase extract to a test tube and place it in a hot water bath for five minutes. Transfer 10 mL of 1.5% H2O2 into a 50-mL beaker and add 1 mL of the boiled catalase solution, after it has cooled. Observe the changes in the reaction. To demonstrate the presence of catalase in living tissue, cut 1 cubic cm of potato, macerate it, and transfer it into a 50-mL glass beaker containing 10 mL of 1.5% H2O2. Observe the results.

Exercise 2B

Put 10 ml of 1.5% H2O2 into a clean glass beaker. Add 1 mL of H2O. Add 10 mL of sulfuric acid (1.0 M). USE EXTREME CARE IN HANDLING ACIDS. Mix the solution well. Remove a 5 mL sample. Place this 5 mL sample in another beaker, and assay for the amount of H2O2 as follows: Place the beaker containing the sample over white paper. Use a burette or 5 mL pipette to add potassium permanganate a drop at a time to the solution until a persistent pink or brown color is obtained. Remember to gently swirl the solution after adding each drop.

Exercise 2C

To determine the rate of spontaneous conversion of H2O2 to H2O and O2in an uncatalyzed reaction, put about 20 mL of 1.5% H2O2 in a beaker. Store it uncovered at room temperature for approximately 24 hours. Put 10 mL of 1.5% H2O2 into a clean glass beaker (using the uncatalyzed H2O2 that set out). Add 1 mL of H2O2 and then add 10 mL of sulfuric acid (1.0 M). Be careful when using acid. Mix this solution well. Remove a 5 mL sample and place it into another beaker. Assay for the amount of H2O2 as follows: Use a 5 mL syringe to add one drop of potassium permanganate at a time to the solution until it becomes a persistent pink or brown color. Gently swirl the solution after adding each drop. Record all results.

Exercise 2D

If a day or more has passed since Exercise B was performed, a baseline must be reestablish. Repeat the assay from Exercise B and record the results. Compare with other groups to check that results are similar. To determine the course of an enzymatic reaction, how much substrate is disappearing over time must be measured. The first thing to be done is to set up the six cups labeled with times, and the other six, one directly in front of each cup with a time on it. Then put 10 mL of 1.5% H2O2 into the cup marked 10 sec. Add 1 mL of catalase extract to this cup. Swirl gently for 10 seconds using a timer or clock for help. At 10 seconds, add 10 mL of sulfuric acid. Remove 5 mL and place in the cup directly in front of the cup marked 10 sec. Assay the 5 mL sample by adding one drop of potassium permanganate at a time until the solution turns a pink or brown. Repeat the previous steps, with clean cups using the times 30, 60, 120, 180, and 360. Record all results and observations.


Results:

Table 1

Enzyme Activity

Activity Observations

Enzyme activity

The reaction caused oxygen gas as a product, which made the wooden splint glow bright red.

Effect of Extreme temperature


Boiling the catalase caused it to denature and it resulted in no bubbling in the solution.

Presence of catalase

The catalase being present in a living thing (potato), caused an extreme reaction with tons of products (02) produced.

 Table 2

Establishing a Baseline

  Volume

Initial reading


10 mL

Final reading


6.7 mL

Baseline ( final volume – initial volume)


3.3 mL

Potassium permanganate


Table 3

Rate of Hydrogen Peroxide Spontaneous Decomposition

  Volume
Initial KMnO4


5 mL

Final KMnO4


.3 mL

Amount of KMnO4 used after 24 hours


4.7 mL
Amount of H2O2 spontaneously decomposed

( ml baseline – ml after 24 hours)

1.4 mL

Percent of H2O2 spontaneously decomposed

( ml baseline – ml after 24 hours/ baseline)

57.6%

Table 4

Reestablishing a Baseline

  Volume

Initial reading


5 mL

Final reading


.8 mL

Baseline ( final volume – initial volume)


4.2 mL

Potassium permanganate


Table 5

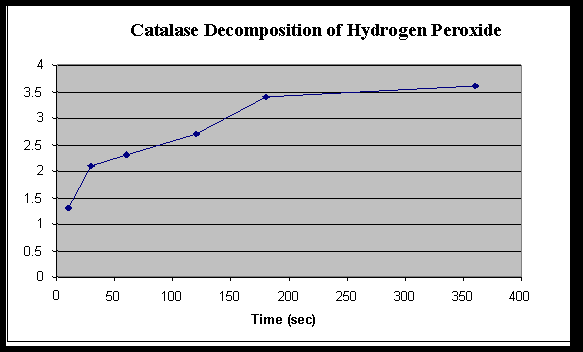
Rate of Hydrogen Peroxide Decomposition by Catalase


Time ( Seconds)

10 30 60 120 180 360
Baseline  KMnO4

4.2 4.2 4.2 4.2 4.2 4.2
Initial volume KMnO4


10 10 10 10 10 10
Final volume KMnO4


7.1 7.9 8.1 8.5 9.2 9.4
Amount KMnO4 used

(baseline – final)

2.9 2.1 1.9 1.5 .8 .6

Amount H2O2 used

(KMnO4 – initial)


1.3 2.1 2.3 2.7 3.4 3.6


Graph 1

Text Box: Hydrogen Peroxide Used (mL)

Exercise 2A

1. a) What is the enzyme in this reaction? Catalase is the enzyme in the reaction.

    b) What is the substrate in this reaction? The substrate is hydrogen peroxide.

 c) What is the product in this reaction? The products are oxygen (gas) and water.

d) How could you show that the gas evolved is oxygen? Using the example of holding a                                                                                                                                                                                                 burning wooden splint over the reaction, the splint glows bright red, therefore showing that oxygen is being let out of the solution.

2. How does the reaction compare to the one using the unboiled catalase? Explain the reason for this difference.  When the boiled catalase was used, there was no bubbling in the solution, which proved that there was no reaction occurring because the extreme heat had denatured the catalase.

3. What do you observe? What do you think would happen if the potato or liver was boiled before being added to the hydrogen peroxide?  The catalase shows a lot of reaction with the potato, causing many bubbles to form in the solution. Also, if the potato were boiled there wouldn’t be any bubbles, because the heat would denature the potato.

Analysis of Results

1. Determine the initial rate of the reaction and the rates between each of the time points. Record the rates in the table below.

Time Intervals (seconds)
  Initial to 10 10 to 30 30 to 60 60 to 120 120 to 180 180 to 360
Rates .13 .04 .007 .007 .0012 .0011


2. When is the rate the highest? Explain why.  The rate is the highest at the beginning of the reaction, because the hydrogen peroxide had been exposed to the air for the least amount of time.

3. When is the rate the lowest? For what reasons is the rate low?  At the longer times the rate was the lowest because the peroxide had been exposed to the air longer.

4. Explain the inhibiting effect of sulfuric acid on the function of catalase. Relate this to enzyme structure and chemistry.  The sulfuric acid lowered the pH level of the solution, which caused the catalase to denature by gaining hydrogen ions and it stopped the reaction immediately.

5. Predict the effect lowering the temperature would have on the rate of enzyme activity. Explain you prediction.  Enzymes work best at optimum temperature, therefore increasing, or in this case, decreasing the temperature would extremely change the rate of the reaction. Lowering the temperature would cause the reaction to slow down.

6. Design a controlled experiment to test the effect of varying pH, temperature, or enzyme concentration.  Since the results of room temperature and heated have already been recorded, using catalase that was completely frozen would test the other end of the spectrum as far as temperature goes.

Error Analysis:

Any errors occurring in this experiment could have been caused by misreading of a syringe, miscalculating the data on the tables, or when the 1.5% H2O2 was mixed that was used in almost all parts of the experiment. Also, in Exercise 2D, if the getting the timing just right with all parts of the lab were a source of error in the experiment.

Discussion and Conclusion:

The main purpose of this lab was to show how enzymes can be affected in reactions with other substances by factors such as pH, temperature, and exposure to the surrounding environment. This lab proved that an extreme increase in temperature (boiling) can cause absolutely no reaction by using the boiled enzyme catalase. Also, by using a potato, it shows that catalase is speeding up the decomposition of hydrogen peroxide in living things, helping all living things survive another day.