pH in Living Systems


pH and Living Systems


Introduction:

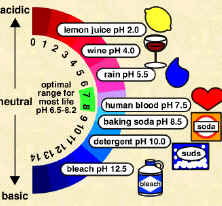
Scientists use something called the pH scale to measure how acidic or basic a liquid is. The scale goes from 0 to 14. Distilled water is neutral and has a pH of 7. Acids are found between 0 and 7. Bases are from 7 to 14. Most of the liquids you find every day have a pH near 7. They are either a little below or a little above that mark. When you start looking at the pH of chemicals, the numbers go to the extremes. Substances with the highest pH (strong bases) and the lowest pH (strong acids) are very dangerous chemicals. Molecules that make up or are produced by living organisms usually only function within a narrow pH range (near neutral) and a narrow temperature range (body temperature). Many biological solutions, such as blood, have a pH near neutral.

The biological molecule used in this lab is a protein found in milk. Proteins are used to build cells and do most of the cell’s work. They also act as enzymes. For proteins to work, they must maintain their globular shape. Changing the shape of a protein denatures and the protein will no longer work.

Materials:

Small squares of wide-range pH paper, pH color chart, paper towels, 4 dropper bottles, ammonia, lemon juice, skim milk, distilled water, forceps, 50 ml beakers, small squares of narrow-range pH paper, 2 stirring rods

Procedure (part A): Testing the pH of Substances

  1. Line up 4 squares of wide-range pH paper about 1 cm apart on a paper towel.
  2. Put one drop of distilled water on the pH square.
  3. Compare the color of the pH paper to the color chart and record the pH in data table 1.
  4. Repeat this procedure for the ammonia, lemon juice, and skim milk.

Questions (Part A): Determining the pH of Solutions

  1. Which substance was the most acidic?
  2. Which substance was the most basic?
  3. Did any of the substances have a pH close to neutral? Name them.

Procedure (part B): Showing the Effect of pH on a Biological Molecule (Milk Proteins)

  1. Place 100 drops of skim milk in a 50 ml beaker.
  2. Pick up a piece of narrow-range pH paper with forceps.
  3. Touch the pH paper to the milk and remove it.
  4. Compare the color of the pH paper to the pH color chart.
  5. Record the initial pH in data table 2.
  6. Add a drop of lemon juice to the milk in the cup & stir with a stirring rod. Keep track of how many drops you add to the milk!
  7. Measure and record the pH of the solution with the narrow-range pH paper.
  8. Repeat step 7 until you notice an obvious change in the appearance of the milk. record this final pH and appearance of the milk in your data table.
  9. Repeat steps 1-8 using a clean 50 ml beaker and fresh milk, and substitute ammonia for the lemon juice.
  10. Add drops of ammonia to the milk until the change in pH of the milk is equal to the change in pH you measured in step 8. Be sure to keep track of the number of drops added. HINT: If the pH changed by 2 units with the lemon juice, then add ammonia until you also get 2 pH units of change!

Data:

Table 1


Substance Tested pH Acid Base Neutral


Table 2

Substance Tested Substance used to Produce Change Starting pH of Milk Final pH of Milk Original Appearance of Milk Final Appearance of Milk Total Number of drops added to Produce the change
100 drops Skim Milk Lemon Juice
100 drops Skim Milk Ammonia

Questions:

1. Which substance tested from table 1 was the most acidic?

2. Which substance was most basic?

3. Did any substance from table 1 have a neutral, or near neutral pH? If so, which substance was neutral?

4. Why did you use narrow-range pH paper to measure the milk’s change in pH?


5. Describe the change in appearance of the milk as more lemon juice was added. Explain why this change occurred.


6. How much did the pH of milk change when lemon juice was added?

7. Why do you think lemon juice “curdled”  (precipitated out the proteins) from the milk?


8. Did you get the same change when ammonia was used? Why or why not?


Photosynthesis Worksheet Ch6 BI


Photosynthesis


Section 6-1 Capturing Light Energy

1. All organisms require ___________________ to carry out their life functions.

2. ___________________ is the ultimate energy for all life on earth.

3. During photosynthesis, the energy from the sun is stored within _____________________

compounds, mainly the sugar _______________________.

4. What organisms can carry on photosynthesis?

5. Name several autotrophic organisms.

6. What is a biochemical pathway and give an example?

7. What gas is used by autotrophs & what gas is produced?

8. What organisms release stored energy from organic compounds through cellular respiration?

9. Draw the diagram showing energy storage & transfer between autotrophs & heterotrophs. (Figure 6.1)

10. What are the light reactions of plants and in what organelle do they occur?

11. Draw & label the parts of a chloroplast. Tell the function of each labeled part.

12. Flattened sacs in chloroplasts are known as ____________________ and are

_______________________ to each other.

13. Thylakoid sacs in chloroplasts are called _____________________________.

14. What gel-like solution surrounds the thylakoids inside the chloroplast?

15. What is the visible spectrum?

16. Name the 7 colors that make up the visible spectrum.

17. What 3 things can happen to light that strikes an object?

18. What are pigments & what is their function in plants?

19. Is red light reflected or absorbed by an object if the object appears red to your eyes?

20. Name the most important chloroplast pigment & tell the 2 most important types of this pigment.

21. Only ________________________ is directly in capturing light energy.

22. Chlorophyll b is an example of an ______________________ pigment in plants.

23.Name another accessory pigment & tell what colors it includes. When could you see these colors?

24. Chlorophyll is most abundant in the _____________________ of a plant, while accessory
pigments appear more in the _________________________ and fruits.

25. The _________________________ and ________________________ pigments are grouped
into clusters in the thylakoid membrane.

26. What is a photosystem?

27. Name the 2 types of photosystems.

28. The light reactions start when __________________ pigments absorb ______________.

29. Absorbed light is passed to a pair of ________________________ pigment molecules in
photosystem ________.

30. When light energy is absorbed by chlorophyll a molecules, what happens to its electrons?

31. Once these electrons become “excited”, they have enough energy to do what?

32. What are the chemicals called that pick up these freed electrons & where are they located?

33. These electrons lose _________________ as they are passed through a series of molecules
called the ______________________________________ chain.

34. Photosystem I chlorophyll molecules also absorb ________________, and its electrons
eventually combine with ______________________ to form NADPH.

35. What would happen if the electrons lost from photosystem II weren’t replaced?

36. ________________________ provides the replacement electrons for photosystem II when
water is __________________________.

37. Write the equation for the splitting of a water molecule.

38. What important gas is released when water is split?

39. ______________ or energy for a cell is synthesized during the light reactions in a process
called ________________________________.

Section 6-2 Calvin Cycle

40. The _________________ cycle is the second set of photosynthetic reactions that uses energy
stored in ________________ and _____________________ to make __________________
compounds.

41. Carbon atoms from ______________ are “fixed” into organic compounds in the Calvin
cycle in a process called carbon _________________________.

42. In what part of the chloroplast does the Calvin cycle occur?

43. Carbon dioxide combines with _______________ to make two molecules of
_____________________________.

44. PGA is converted into ________________, ADP, _________________, and
phosphate.

45. Carbohydrates made from PGAL in the Calvin cycle include the monosaccharides
______________________ and ______________________, the disaccharide
_______________________, and polysaccharides such as _____________________,
________________________, and _______________________.

46. Write the balanced equation for photosynthesis. (See bottom of page 118.)

47. Plants that fix carbon through the Calvin cycle are called what type of plants?

48. What are stomata & where are they located?

49. When would plant cells need to close or partially close their stomata?

50. Name 2 alternate carbon-fixing pathways used by plants in hot climates.

51. Plants that close their stomata during the hottest part of the day thus fixing carbon into four
carbon compounds are called ______________________. Name three.

52. CAM plants open stomata at ______________ and close during the _________________.

53. Name 3 environmental factors that affect the rate of photosynthesis.

BACK


Natural Selection Activity


Survival of the Fittest


Introduction:

  Within a population, organisms will vary.  Charles Darwin stated that in the struggle for existence, those variant organisms that have favorable variations are “better adapted” to their environment and will survive and reproduce in greater numbers.  Favorable variations may mean that they are faster, or stronger, or able to eat different types of food, or better camouflaged to avoid predators.  In this lab you will simulate the effect of predation by a hawk on a large population of assorted mice.  Your population of mice will consist of black, white, and speckled mice.  You will represent the hawk.

Objectives:

  –to simulate the effect of hawk predation on the appearance of mice
-to simulate the natural selection of traits

Materials:

large sheet of newspaper  4 hawks (students)
30 white mice (paper squares) 1 petri dish
30 speckled mice (paper squares)
30 black mice (paper squares)

Procedure:

  1. Open your sheet of newspaper and place it on the lab table.  This will serve as the environment for your mice.
  2. Place the petri dish on the other side of the lab table.  This will be the nest.
  3. Select one person from your group to act as a hawk.  This person should stand by the nest.
  4. Spread the mice on their environment evenly.
  5. The hawk now swoops over and has 1 minute to pick up as many mice as possible. The hawk may only pick up one mouse at a time, and must place it in their nest (a petri dish) before flying back to pick up another.  The goal is to pick up as many mice as possible in the time period.
  6. When the time is up record the number of mice left in the environment in the data table below.
  7. Repeat this procedure for each person in the lab group or 4 times. 
  8. After all data is collected, construct a bar graph. Be sure to label the graph and its axes.
  9. Data:


White
mice
Speckled mice
Black
mice
Hawk #1  


Hawk #2  


Hawk #3  


Hawk #4  


Total  


Conclusion:
 Write a paragraph describing;

* the purpose of the lab

* what you thought the results would be

* what the results were (discussing numbers from data)

*how the mouse population and hawk population may change over time from natural selection


Natural Selection Peanut Activity


Natural Selection Within a Species


Introduction:

Natural selection is the evolutionary process by which the most adaptable individuals survive. An adaptation is an inherited variation that helps an organism to survive. When the organism survives, its chances of reproduction are increased as well as its ability to pass on its inherited traits.  All members of a species are different from one another.  In this activity, you will investigate two variations among peanut plants — length of shell and number of seeds per shell.   Most shells contain a certain number of seeds which is an adaptation to its survival.  

Objective:

Students will investigate natural selection in peanuts.

Materials:

50 peanuts in shells, metric ruler, pencil, graph paper

Procedure:

  1. Count out 50 peanuts in their shells.
  2. Use a metric ruler to measure the length of each shell in millimeters.  Put a check mark in Table 1 in the space indicating the length of the shell.
  3. Open the shell and count the number of seeds inside.  Put a check mark in Table 2 in the space next to the number of seeds that you counted. 
  4. Repeat steps 1 – 3 for the other 49 peanuts.
  5. Set up two bar graphs using the headings from each table as the axes for each graph.
  6. Plot a bar graph from the data in each table.

Data:

Table 1


Length of Shell
(mm)
Number of Shells
5-10
10-15
15-20
20-25
25-30
30-35
35-40
40-45
45-50
50-55
55-60
60-65
65-70
70-75


Table 2


Number of Seeds Per Shell Number of Shells
1
2
3


Title: ________________________________________________________


Title: ________________________________________________________


Questions:

  1. What is the most common length of the shells you measured?
  2. What was the most common number of seeds in the peanut shells that you opened?
  3. What might happen if each shell contained fewer than normal seeds and why?
  4. What might happen if each shell contained more than the normal number of seeds and why?
  5. Was there a relationship between the most common length of shells and the number of seeds they contained? Explain your answer.
  6. Write 1-2 paragraphs explaining how shell length and seed number in peanuts illustrates natural selection within this species.


Nucleotide Model preap


Model of a Nucleotide


Introduction

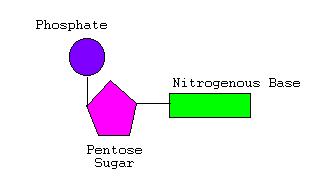
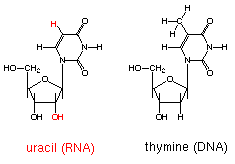
Nucleotides consist of three parts — a pentose sugar, a nitrogen-containing base, and a phosphate group. A pentose sugar is a five-sided sugar. There are 2 kinds of pentose sugars — deoxyribose and ribose. Deoxyribose has a hydrogen atom attached to its #2 carbon atom (designated 2′), and ribose has a hydroxyl group atom there. Deoxyribose-containing nucleotides are the monomers of DNA, while Ribose-containing nucleotides are the monomers of RNA.

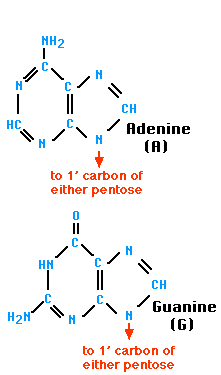
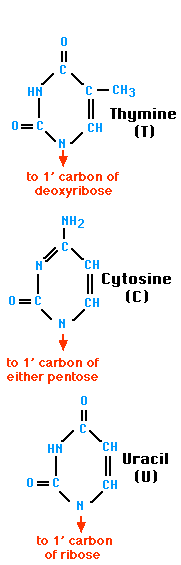
A nitrogen-containing ring structure is called a base. The base is attached to the 1′ carbon atom of the pentose. In DNA, four different bases are found — two purines, called adenine (A) and guanine (G) and two pyrimidines, called thymine (T) and cytosine (C). RNA contains The same purines, adenine (A) and guanine (G).  RNA also uses the pyrimidine cytosine (C), but instead of thymine, it uses the pyrimidine uracil (U).


The Purines The Pyrimidines

The combination of a base and a pentose is called a nucleoside.  A phosphate group is attached to the 5′ carbon of the pentose sugar.

Objective

Students will construct a 3-dimensional model of a single nucleotide, the monomer of which nucleic acids are composed.

Materials

Various materials may be used for the atoms that make up a nucleotide such as styrofoam balls, plastic coke bottle caps, beads, etc. Bonds between atoms may be made from toothpicks, plastic stirring sticks, popsicle sticks, etc. Single & double bonds must be represented by the correct number of “sticks”. The atoms and bonds may NOT be made of any food item. Your model should be glued together to make the model rigid for hanging. Attach string and a label with the nucleotide’s name to your model. Models must be sturdy, light weight, and small enough to hang from the ceiling.

Color Code for atoms:

CARBON – BLACK
HYDROGEN – YELLOW
OXYGEN – RED
NITROGEN – BLUE

Structural Formulas of Nucleotides:

Uracil Nucleotide (Ribose ) & Thymine Nucleotide (Deoxyribose)


Adenine Nucleotide (Deoxyribose)
Cytosine Nucleotide (Deoxyribose)
Guanine Nucleotide (Deoxyribose)