Biological Magnification: Definition, Examples, and Practice

Biological magnification is a rising concern amongst researchers who examine the ways that chemicals and pollutants may have long-term effects on ecosystems.  In this article, we’ll dive deep into what it is and the impacts it’s already had on our environment. 

biological magnification

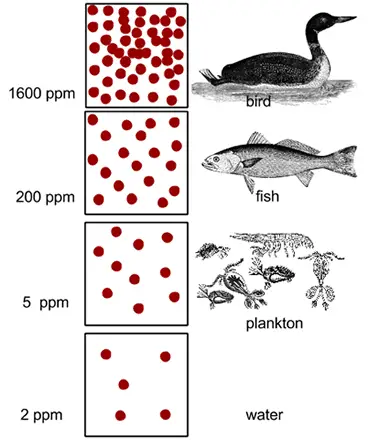
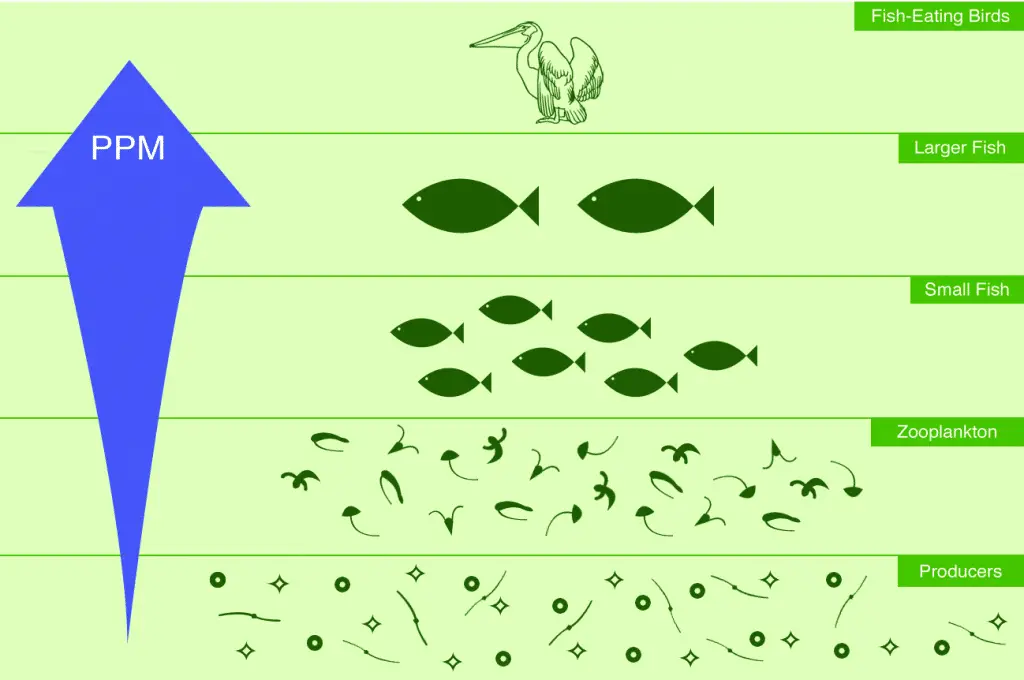
Biology researchers and students are likely familiar with the field of ecotoxicology, or the study of how chemicals and toxins affect ecosystems and their organisms.  In this field, the term biological magnification is frequently used to describe the amplified concentrations of these substances as you move up through the food chain.

Also fittingly called bioamplification or biomagnification, this process explains why harmful substances like have metals, or chemicals found in fertilizers or pesticides, present in even the largest, carnivorous predators.

In this article, we will discuss the process of biomagnification and how it works.  We will define the terminology, and then give real-life examples and case studies documenting how chemicals travel through soil, water, and smaller organisms to eventually make their way to the top of the food chain in large concentrations.  

What is Biological Magnification?

Put simply; the term biological magnification is used to describe the process by which substances used in farming or produced in industrial waste make their way into and up the food chain.

We see increased levels of these toxins and chemicals accumulating through the trophic levels of the food chain thanks to this phenomena.

Pesticides, fertilizers, and heavy metals from industrial waste are some of the most common culprits who contribute to the problem.

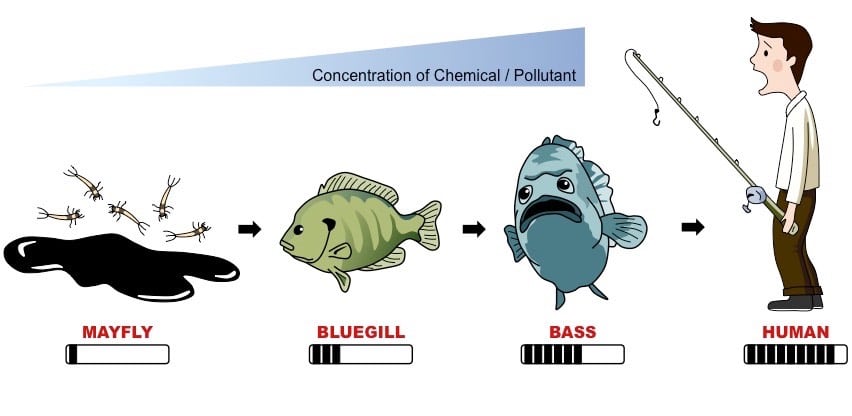
Typically, the materials are carried through water sources like rivers, lakes, and streams as a result of surface runoff where they are then ingested by aquatic animals like frogs or fish.  These small organisms are then preyed upon by predators higher up in the food chain, like birds, larger fish, or animals, which is how these same substances make their way into their body.

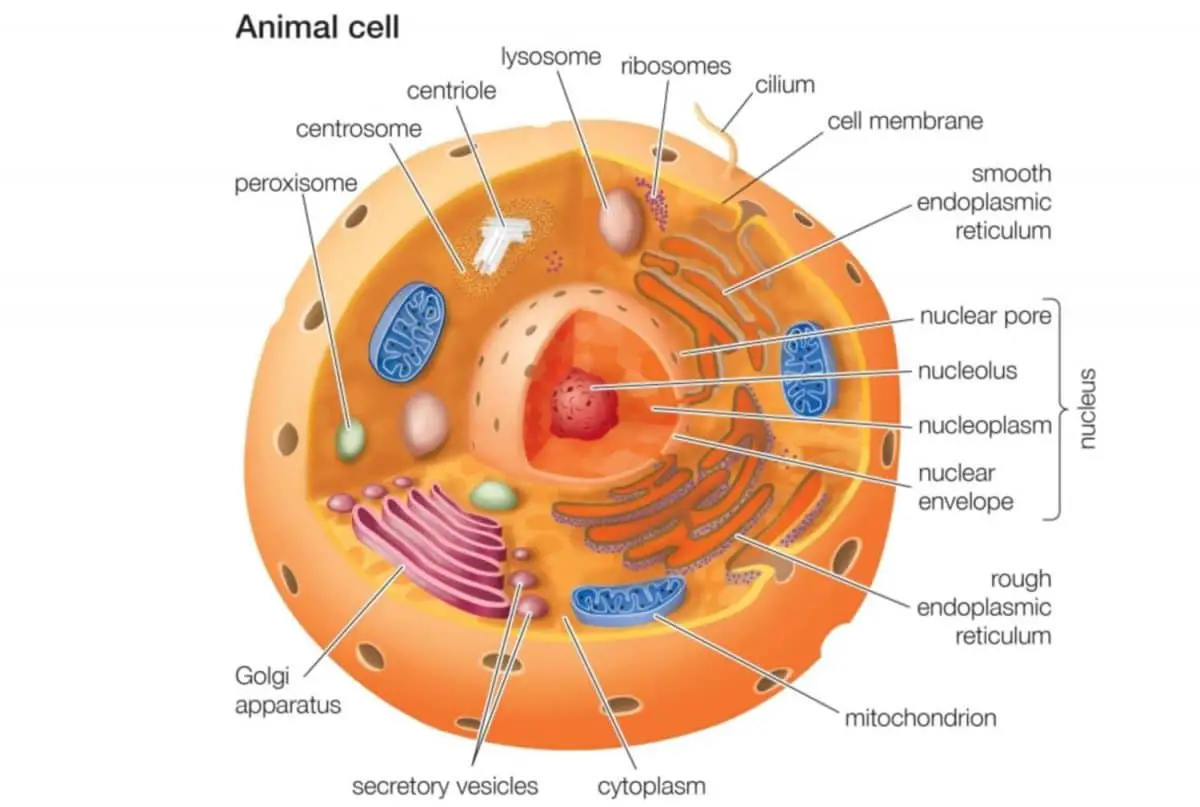
Many of these toxins and chemicals are fat soluble and get stored in their internal organs or fat tissue.  This results in an accumulation of the substance over time and in greater concentrations the higher up the food chain you go.  This phenomenon is called food chain energetics.

Although biomagnification doesn’t always have a direct effect on living organisms, long-term exposure to harmful chemicals may result in unpleasant and irreversible side effects that could threaten a species.

Biological Magnification vs. Bioaccumulation

Biomagnification

It’s important to note that there is a significant difference between biomagnification and bioaccumulation.  Although some may use the words interchangeably, they actually describe different scenarios in an organism.

Biological magnification specifically refers to increasing concentration of materials in each higher link in the food chain.  However, bioaccumulation examines the increased presence of a particular substance inside a single organism.

While the two processes may be interconnected, for the purpose of this article it’s important to differentiate the terminology to understand the real-life examples and practice.

Examples of Biological Magnification

There are numerous, well-documented examples of biomagnification where researchers find high concentrations of chemicals in apex predators.  Many of these studies also demonstrate the potential negative consequences of this build up over time. Here are a few examples.

Bald Eagles

During World War II troops faced a plethora of health issues, including outbreaks of malaria, body lice, typhus and bubonic plague spreading through mosquito bites at encampments throughout the world.

DDT is a pesticide that was developed to kill these biting bugs to help control the spread of these diseases, and following the war had agricultural applications.  Farmers used the product on their crops to control pests, and it was both popular and widespread thanks to its low cost and easy application.

It was approved as being safe and effective by the EPA at the time because there did not appear to be any harmful side effects of ingesting the chemical in animals or humans.  However, this did not take into account the possibility of biomagnification. 

DDT doesn’t break down over short periods of time in the environment and is a substance that gets stored in the fatty tissues of animals who consume it.  This became particularly problematic for bald eagles.

A predator near the top of the food chain, bald eagles were consuming large quantities of fish who had been affected by the chemical.  Runoffs from farms hit the waterways, and DDT infiltrated aquatic plants and animal life, and the eagles ingested the chemical with each meal they ate.

Over time, the chemical disrupted their ability to lay eggs with strong shells, causing the bald eagle population to decrease to the point of near extinction.  In 1940, Congress stepped in to pass an act to protect the species, but DDT wasn’t banned until 1972.

It wasn’t just species of eagles affected.  Other predator birds like brown pelicans and peregrine falcons saw the same side effects.  The thinning off the eggshells made incubation and hatching near impossible and also threatened these bird populations.

Fish and Pregnancy

Another notable example of biomagnification is in predator fish.  Species like Shark, Swordfish, Orange Roughy, Tuna, King Mackerel, or Tilefish contain proportionally larger levels of toxic mercury than smaller fish and shellfish.

In fact, the levels are so high that the FDA advises that pregnant women avoid consuming these species for fear of exposing developing fetuses to levels that may cause nerve damage.

How does this toxicity occur?  Mercury is introduced into the ecosystem in one of two ways.  As a naturally occurring element, it can leach from rocks and volcanoes into our water supply over time, but those natural changes are not likely to significantly impact the environment.

However, when you take the natural occurrences and combine them with human contributions through coal-burning power plants which impact the air, rain, soil, and water around these facilities, the mercury levels rise drastically.

As we now know, once an element enters the water supply, it’s inevitable that it gets ingested by aquatic life at every level of the food chain.  When plankton and small crustaceans that make up the majority of the diet of the larger, predatory fish have moderate levels, then the species who eat them will have a compounded effect.

For example, according to the FDA, the average amount of mercury found in a serving of scallops is 0.003 parts per million.  Lobsters, one of the main predators of the scallop have a concentration of 0.107 parts per million.  

Monkfish love dining on lobster, and have an average of 0.161 parts per million of mercury in their system, and shark and swordfish at 0.979 and 0.995 parts per million respectively regularly dine on monkfish.

In this example, it’s easy to see how quickly the effects compound and how concentrated they become with only four steps up the food chain ladder.

What Causes Biological Magnification?

natural phenomenon

Although biomagnification is a natural phenomenon that happens in all organisms, the instances where it is worrisome are largely due to anthropogenic factors.  Materials that humans introduce into the environment can cause unexpected and hazardous side effects and typically fall into one of the following subcategories.

Organic Contaminants

We live in an age where the word organic is closely correlated with natural and healthy, but too much of anything could be bad.  Organic elements like phosphorus, nitrogen, and carbon are necessary for survival, but if they appear in excessive quantities in ecosystems, they may cause eutrophication.

Eutrophication is a phenomenon when an organism that thrives in these conditions, like algae, for example, experience exponential growth and suddenly have an overwhelming population.  This can then disrupt the ecosystem and kill off other organisms because there aren’t enough resources, like oxygen, to go around.

Waste

Waste produced from manufacturing plants, factories, and other industrial enterprises can release waste and toxins into the air and water that contribute to the problem. 

Agricultural and Industrial

Chemicals introduced into the environment from inorganic pesticides, fungicides, fertilizers and herbicides that mix with our natural water sources due to runoff when it rains release toxic elements as well.

Plastic Pollution

Not only does plastic physically impact our environment, often ending up in our oceans and disrupting marine ecosystems, but it can also leach toxic chemicals into water too.

For example, Bisphenol A, or BPA, has made headlines recently as a substance that can produce a range of health conditions in humans that is used in making plastic water bottles.  It is one of the leading chemical pollutants in the environment.

Heavy Meals

As we discussed in our earlier case study, heavy metals that enter our water sources can wreak havoc on the ecosystem.  Mining activities are sometimes at fault for releasing deposits that can pollute aquatic plants and contaminate water sources with elements like zinc or cobalt.  

Potential Negative Effects of Biological Magnification

DDT and mercury aren’t the only hazardous substances that have the potential to biomagnify.  Substances like polychlorinated biphenyls (PCB’s) that can impair reproductive systems, heavy metals, polynuclear aromatic hydrocarbons which are a known carcinogenic, cyanide, and selenium have been extensively studied and proven to have similar outcomes.

There are dozens of potential adverse effects to our environment, including but not limited to:

  • Reproductive implications for marine and other animal life
  • Killing coral reef ecosystems
  • Disrupting the natural food chain as species die off

There is also a significant risk of health impacts on humans who consume many of the organisms affected by this process.  They include an increased risk of the following:

  • Cancer
  • Kidney failure
  • Liver disease
  • Birth defects
  • Brain damage
  • Respiratory disorders
  • Heart disease

biomagnification

Final Thoughts

Bioamplification isn’t a new phenomenon, but the humans have introduced pollutants to the environment that makes it a threat to the ecosystem and our food sources.  Understanding how and why it occurs is the first step to combating the problem and preventing the destruction over time.

Conversations and advocacy for sustainability need to continue to ensure the long-term health of our environment.

Dimensional Analysis: Definition, Examples, And Practice

If you’ve heard the term “dimensional analysis,” you might find it a bit overwhelming. While there’s a lot to “unpack” when learning about dimensional analysis, it’s a lot easier than you might think. Learn more about the basics and a few examples of how to utilize the unique method of conversion.

Dimensional Analysis: Definition, Examples, and Practice

As a student of Biology or any of the sciences, you will have to use math of some kind, and there’s a good chance that you will find dimensional analysis (or unit analysis) to be helpful. Math equations and other conversions can be overwhelming for some, but dimensional analysis doesn’t have to be; once you learn it, it’s relatively easy to use and understand.

We’ll give you the basics and give you some easy-to-understand examples that you might find on a dimensional analysis worksheet so that you can have a general understanding about what it is and how to use the technique in all types of applications as you continue to take science courses.

What Is Dimensional Analysis?

As we mentioned, you may hear dimensional analysis referred to as unit analysis; it is often also known as factor-label method or the unit factor method. A formal definition of dimensional analysis refers to a method of analysis “in which physical quantities are expressed in terms of their fundamental dimensions that is often used.”

Most people might agree that this definition needs to be broken down a bit and simplified. It might be easier to understand this method of analysis if we look at it as a method of solving problems by looking converting one thing to another.

While dimensional analysis may seem like just another equation, one of the unique (and important) parts of the equation is that the unit of measurement always plays a role in the equation (not just the numbers).

We use conversions in everyday life (such as when following a recipe) and in math class or in a biology course. When we think about dimensional analysis, we’re looking at units of measurement, and this could be anything from miles per gallon or pieces of pie per person.

Many people may “freeze up” when they see a dimensional analysis worksheet or hear about it in class, but if you’re struggling with some of the concepts, just remember that it’s about units of measurements and conversion. Dimensional analysis is used in a variety of applications and is frequently used by chemists and other scientists.

The Conversion Factor in Dimensional Analysis

One important thing to consider when using dimensional analysis is the conversion factor. A conversion factor, which is always equal to 1, is a fraction or numerical ratio that can help you express the measurement from one unit to the next.

When using a conversion factor, the values must represent the same quantity. For example, one yard is the same as three feet or seven days is the same as one week. Let’s do a quick example of a conversion factor.

Imagine you have 20 ink pens and you multiply that by 1; you still have the same amount of pens. You might want to find out how many packages of pens that 20 pens equal and to figure this out, you need your conversion factor.

Now, imagine that you found the packaging for a set of ink pens and the label says that there are 10 pens to each package. Your conversion factor ends up being your conversion factor. The equation might look something like this:

20 ink pens x 1 package of pens/10 pens = 2 packages of ink pens. We’ve canceled out the pens (as a unit) and ended up with the package of pens.

While this is a basic scenario, and you probably wouldn’t need to use a conversion factor to figure out how many pens you have, it gives you an idea of what it does and how it works. As you can see, conversion factors work a lot like fractions (working with numerators and denominators)

Even though you’re more likely to work with more complex units of measurement while in chemistry, physics, or other science and math courses, you should have a better understanding of using the conversion factor in relation to the units of measurement.

Steps For Working Through A Problem Using Dimensional Analysis

Like many things, practice makes perfect and dimensional analysis is no exception. Before you tackle a dimensional analysis that your instructor hands to you, here are some tips to consider before you get started.

  • Read the problem carefully and take your time
  • Find out what unit should be your answer
  • Write down your problem in a way that you can understand
  • Consider a simple math equation and don’t forget the conversion factors
  • Remember, some of the units should cancel out, resulting in the unit you want
  • Double-check and retry if you have to
  • The answer you come up with should make sense to you

To help you understand the basic steps we are using an easy problem that you could probably figure out fairly quickly. The question is: How many seconds are in a day?

First, you need to read the question and determine the unit you want to end up with; in this case, you want to figure out “seconds in a day.” To turn this word problem into a math equation, you might decide to put seconds/day or sec/day.

The next step is to figure out what you already know. You know that there are 60 seconds to one minute and you also know that there are 24 hours in one day; all of these units work together, and you should be able to come up with your final unit of measurement. Again, it’s best to write down everything you know into an equation.

After you’ve done a little math, your starting factor might end up being 60 seconds/1 minute. Next, you will need to work your way into figuring out how many seconds per hour. This equation will be 60 seconds/1 minute x 60 minutes/1 hour. The minutes cancel themselves out, and you have seconds per hour.

Remember, you want to find out seconds per day so you’ll need to add another factor that will cancel out the hours. The equation should be 60 seconds/1 minute x 60 minutes/1 hour x 24 hours/1 day. All units but seconds per day should cancel out and if you’ve done your math correctly 86,400 seconds/1 day.

When doing a dimensional analysis problem, it’s more important to pay attention to the units and make sure you are canceling out the right ones to get the final product. Doing your math correctly important, but it’s easier to double-check than trying to backtrack and figure out how you ended up with the wrong unit.

Our example is relatively simple, and you probably had no problem getting the right answer or using the right units. As you work through your science courses, you will be faced with more difficult units to understand. While dimensional analysis will undoubtedly be more challenging, just keep your eye on the units, and you should be able to get through a problem just fine.

Why Use Dimensional Analysis?

As we’ve demonstrated, dimensional analysis can help you figure out problems that you may encounter in your everyday. While you’re likely to explore dimensional analysis a bit more as you take science courses, it can be particularly helpful for Biology students to learn more.

Some believe that dimensional analysis can help students in Biology have a “better feel for numbers” and help them transition more easily into courses like Organic Chemistry or even Physics (if you haven’t taken those courses yet).

Can you figure out a math equation or a word problem without dimensional analysis? Of course, and many people have their own ways of working through a problem. If you do it correctly, dimensional analysis can actually help you answer a problem more efficiently and accurately.

Ready To Test Your Dimensional Analysis Skills?

If you want to practice dimensional analysis, there are dozens of online dimensional analysis worksheets. While many of them are pretty basic or geared towards specific fields of study like Chemistry, we found a worksheet that has an interesting variety. Test out what we’ve talked about and check your answers when you’re done.

  • How many minutes are in 1 year?
  • Traveling at 65 miles/hour, how many minutes will it take to drive 125 miles to San Diego?
  • Convert 4.65 km to meters
  • Convert 9,474 mm to centimeters
  • Traveling at 65 miles/hour, how many feet can you travel in 22 minutes? (1 mile = 5280 feet)

Ready to check out your answers and see more questions? Click here.

Cell Parts 101: Plant And Animal Cell Helpful Study Guides

How much do you know about cell parts? Can you list the differences between plant and animal cells? Here are the main differences you need to know about between these two cell types. We have also found some study guides to help you go further.

animal cell

Plant and animal cells have many similarities, including shared organelles. However, these cells differ in size and structure. They also use a different mechanism for respiration. Here is what you need to know about animal and plant cell parts.

The Main Differences Between Plant And Animal Cells

plant cell

The most noticeable difference between plant and animal cells is the size. An animal cell will typically range between 10 and 30 micrometers in length, while a plant cell can reach 100 micrometers in length.

Plant cells are larger because they contain vacuoles that store water. Animal cells also have vacuoles, but these organelles aren’t used to store water.

The cell wall is another important difference. Animal cells are protected by a cell membrane. Plant cells also have a membrane, but there is an outer layer made of cellulose. This outer layer is called the cell wall since it is rigid.

The rigid cell wall helps shape plant cells. These cells typically have a rectangular or cube shape. There is far less variety in the shapes of plant cells compared to animal cells. Animal cells have more varied shapes and have irregular shapes.

The mechanism used for growth is also different. Animal cell growth is achieved by producing new cells while plant cells grow by increasing their size. This is achieved by storing more water in the vacuoles of a cell.

Energy is stored differently. Animal cells store energy in the form of complex carbohydrate glycogen while plant cells store energy in the form of starch.

Plant cells can produce more amino acids than animal cells. There are 20 different amino acids cells used to produce proteins. Animal cells can typically produce 10 of these amino acids and will need to obtain the rest from nutrients that come from the animal’s diet while plants can synthesize 20 amino acids.

Different Organelles

There are a few different cell parts that are unique to animal and plant cells. The core organelles such as the nucleus are shared by both cell types.

The centrioles are organelles that organize and structure the microtubules during the process of cell division. Animal cells have centrioles while plant cells don’t.

The primary cilium isn’t present in plant cells. Animal cells have a primary cilium to detect external stimuli, and some animal cells have more cilium to make the cell move.

Plant cells need to digest lipids, which is why they have organelles known as glyoxysomes. These cell parts aren’t found in animal cells.

Animal cells rely on lysosomes for digesting macromolecules. Lysosomes can digest old organelles, viruses, bacteria, and nutrients. The vacuoles have a similar purpose in plant cells.

The chloroplasts are another major difference between plant and animal cells. These cell parts play a crucial part in the photosynthesis process that plant cells are known for. These organelles transform light into energy the cell can use.

Even though vacuoles are present in both cell types, these organelles are different. Animal cells have small vacuoles while plant cells have vacuoles that can take up as much as 90 percent of a cell’s volume. Vacuoles are used for storing nutrients in animal cells, while they store water in plant cells.

Different Processes

The differences in structure and organelles mean that some processes happen differently between plant and animal cells.

Cell division is slightly different. With animal cells, the cytoplasm and the cell membrane is pinched in half until the cell completely divides. With plant cells, a plate is constructed to divide the cell in two.

Plant and animal cells communicate differently. There are pores called plasmodesmata in the wall of a plant cell. Molecules and communication signals can exit the cell via these pores.

Animal cells don’t have plasmodesmata. Instead, there are proteins embedded in the outer membrane of the cell that let nutrients and chemicals in and out of the cell. These proteins can bind with a hormone or another transmitter to communicate a signal.

There are some similarities in cell respiration. Both cell types will break down glucose molecules to produce carbon dioxide, water, and ATP. The main difference is that animal cells absorb glucose as a nutrient while plant cells produce glucose via photosynthesis.

Study Guides

You can learn more about plant and animal cells with these study guides. We have found the best resources for learning about cells and organelles and have organized them.

The Basics

You can get started with this table that sums up the main differences between plant and animal cells. This study guide is made for younger students, but this is a good way to brush up on what you already know about cells.

You can then move on to this more comprehensive study guide about the different organelles. You should print this study guide and use it as a reminder of what different organelles do. If you have already studied organelles in class, this study guide will help you keep this knowledge fresh in your mind. It’s a great starting point if you are new to learning about the different parts of a cell.

We have found this helpful quiz you can use to assess how much you know about organelles and their functions. Don’t move on to other topics until you can answer all these questions.

We also like this video about organelles. If you are more of a visual learner, this video should be a helpful resource you can go back to and go over the different organelles and their functions.

Plant Vs. Animal Cells

If you want to explore the differences between plant and animal cells, the Khan Academy has an excellent article on this topic. The material is designed for high school students, but it is a very comprehensive review of the differences between these cell types.

We have found another helpful resource on this topic. We like this study guide because it organizes the information by organelle. This is the best resource for studying how cell structures and parts differ between plant and animal cells.

Eukaryotic And Prokaryotic Cells

Eukaryotic And Prokaryotic Cells

We have been focusing on eukaryotes, but this study guide is an excellent resource if you need a reminder of the difference between eukaryotic and prokaryotic cells.

Test Your Knowledge

We have found this online activity where you can label the different parts of an animal cell. This activity requires you to label the different parts of a plant cell.

Try to briefly explain what the different organelles do as you label them. Take the time to practice with these activities because you are likely to have to label similar diagrams in tests.

Going Further

There are different topics that we briefly mentioned to point out the differences between plant and animal cells. You can use these study guides to explore these topics further.

Note that these study guides are more advanced and are designed for college-level students. You should still be able to follow these study guides if you are in an AP class or if you are curious to learn more about biology.

You can start learning about cell cycle with this study guide. It will help you gain a better understanding of how the functions of the different organelle help cells grow and reproduce.

This study guide is about cell division. It is best to start learning about the entire cell cycle and then focus on the process of cell division.

We talked about cell respiration and photosynthesis. You can assess how much you know about cell respiration by going over these questions and answering them as best as you can.

The Khan Academy has a very comprehensive course on the topic of cell respiration. The information is well-structured, and you will be able to take quizzes as you go through the content to see how much you have learned. You can explore the introduction section by itself to get an overview of how cell respiration works without going into details and looking at the chemical aspect of this process.

This overview of photosynthesis is very comprehensive and will help you gain a better understanding of this process.

Flashcards And Quizzes

Flashcards are a great way to assess how much you know and to review the information you have already studied. We have found different sets of flashcards and quizzes you can use to test your knowledge, expand your vocabulary, and make sure you have understood all the important concepts linked to cells.

Here are the best flashcards and quizzes we found:

The key to learning about plant and animal cells is to organize your study sessions. You could have some sessions dedicated to learning about the different organelles or decide to focus on a specific type of cell. You can then move on to learning about different mechanisms and processes like respiration and division.

Ten Punnett Square Worksheet Ideas for Middle School through AP Levels

The Punnett square worksheet is a great teaching tool for genetics. This worksheet helps students get an idea of the different possible combinations for genetic traits and helps them calculate how likely each combination is. Here are some ideas for using the Punnett square in your classroom.

Punnett square

The Punnett square is a diagram used to make sense out of genetics and inheritance. The purpose of this diagram is to show the different possible combinations of alleles. This is a useful tool you can use to teach biology and probabilities regardless of the level of your students. Here are a few ideas to use the Punnett square in your classroom.

Understanding Dominant And Recessive Alleles

You should talk about genetics and alleles before introducing the Punnett square worksheet in your classroom. Students should ideally also have a good understanding of how to calculate probabilities.

Students should be familiar with genes and understand that genes are a unit of hereditary information while an allele is a possible sequence or variant of a gene.

You should also talk about observable genetic traits, also known as phenotypes. Students should understand that there are dominant and recessive alleles that won’t become phenotypes unless they are combined with another recessive allele. You can introduce the notion of codominant alleles with high school students.

Make sure the Punnett square activities are connected to lessons about genetics, inheritance, and alleles. You can use these activities to introduce these concepts or to help students get a more thorough understanding of genetics and probabilities.

The Punnett Square

The Punnett square is a simple diagram that shows the different possible combinations. Here is an example for the offspring of two organisms with the same Aa allele combination:

  A a
A AA Aa
a Aa aa


Using this worksheet helps students see all the different possibilities and gives them an idea of which phenotype is more likely to occur.

Ten Ideas For Using The Punnett Square Worksheet In Your Classroom

Middle School

Introduce The Punnett Square With Legos

You can use Legos to introduce the Punnett square to your students. This visual approach would be ideal for an activity that you will use to introduce concepts like genetics and alleles.

You need to have Legos with two different shapes to represent the dominant and recessive alleles. Use cups or other small containers to represent the animals or plants that inherit the genetic material.

Start with two cups that contain a different combination of two Lego shapes to represent the parents. Have the students fill out the worksheet with the four possible combinations of Lego shapes.

The students can then place the four different combinations inside of four cups or small containers that represent the offspring.

This approach helps students understand the logic behind the Punnett square and gives them a visual reference you can use once you start talking about alleles.

Plant Genetics

Plant Genetics

Plants are a great example at the middle school level because you can easily identify a phenotype that students will understand, such as the color of a flower. You can even grow flowers in the classroom to illustrate the lesson.

Students can fill out a Punnett square worksheet for plant genetics. The purpose of this activity is to introduce the idea of dominant and recessive alleles and have students get used to seeing a capital letter for the dominant trait and a lowercase letter for the recessive trait.

Create a simple worksheet with four squares and ask students to write the different possible combinations. You can work with different phenotypes:

  • Create a worksheet for a blue flower BB and a blue flower Bb.
  • Create a worksheet for a blue flower Bb and a white flower bb.
  • Create a worksheet for a tall plant TT and a tall plant Tt.
  • Create a worksheet for a tall plant Tt and a small plant tt.

You can then ask students to identify the number of possible combinations and to calculate the probability of a flower being blue or of a plant being tall. You can also have students draw what the plants will look like.

High School

You can introduce advanced ideas at the high school level and connect the Punnett square with more real-life examples. You should introduce concepts like homozygous genes, heterozygous genes, or mutations.

You can also focus on probabilities and have students use a worksheet to calculate the probability of a trait appearing in offspring.

Predicted Outcome And Actual Outcome

Introduce the idea that the predicted outcome of a Punnett square doesn’t always reflect what happens in real life. Students should be aware that these worksheets will show how likely an allele combination is.

Have students use a Punnett square worksheet to predict the outcome of a coin flip or another random event. Once the worksheet is filled out, have students flip a coin and compare the outcome with what the Punnett square predicted.

Guessing The Parents’ Allele Combination

Provide students with different allele combination for the offspring and tell them how frequent each combination is.

Have them use the Punnett square to find the allele combinations of the parents. This is an activity that only takes a few minutes to complete, but it is a great way to brush up on how the Punnett square works and to make sure that students have a solid understanding of inheritance.

Bear Fur Color

You can work with phenotypes that are observable in animals and introduce the idea that there are different possible allele combinations for the same phenotype.

The brown bear fur color is an excellent example since a bear can have BB or Bb alleles and have brown fur. On the other hand, only a bear with a bb allele combination will have black fur.

Have your students use the Punnett square to calculate the probability of offspring having brown or black fur. This problem encourages students to create more complex tables since the bear parents can either have the BB or Bb allele combination.

Eye Color

eye

Predicting eye color is another interesting activity you can introduce at the high school level. Start by making a list of the different possible allele combinations for each eye color.

You can have students calculate the probability of their eye color based on the eye color of their parents, or have students determine the allele combinations of two parents based on the phenotypes of their children.

Eye color is more complex than other phenotypes and gives students an opportunity to create more advanced worksheets that reflect the different possible allele combinations of the parents based on their phenotypes.

You can make things more complicated and combine eye color with hair color.

Research

Have students research different genetic traits and create a presentation on how these traits are inherited. You can have students work in groups and assign a trait to each group.

Students will have to define the trait you assigned to them, explain how it is inherited, and create different Punnett squares that show how the trait can be inherited or skip a generation.

Here are a few examples:

  • A specific hair color.
  • A specific eye color.
  • Tongue rolling.
  • Freckles.
  • Free or attached earlobes.

This project will help students understand how complex genetic inheritance is and will also help them connect what they learned in class with real-world examples.

AP Level

Cat Coat Genetics

Students can look at pictures of cats and predict what the offspring will look like with Punnett squares. This is similar to the bear fur activity, but cat coat genetics are more complex.

Students will have to work with genotypes that affect hair length as well as color. Here are a few facts to help you get started with planning this activity:

  • A cat with short hair will have an LL or Ll genotype.
  • A cat with long hair will have an ll genotype.
  • A cat that is entirely white can have a WW or Ww genotype. A cat with white fur and some colored hair has a ww genotype.
  • White cats can have a W allele and another allele for a dense pigment or piebald spotting.
  • There is a gene for dense pigment. A black, brown, or orange cat will have a DD or Dd allele combination.
  • A cat with gray, cream or light brown fur will have a dd allele combination.
  • Piebald cats with the SS and Ss allele combination have some white hair, while piebald cats with no white hair have the ss genotype.

Genetic Disorders

Genetic Disorder

You can combine the Punnett square with topics like genetic disorders. Studying how sickle cell anemia is inherited could be an interesting project for AP level students.

You can have students create a worksheet to determine the probability of a child inheriting sickle cell anemia based on the parent’s allele combinations.

Have Students Create A Species

Have students design a species from scratch to test their understanding of genetic rules. Ask them to make a list of dominant and recessive traits. Determine how many traits students will have to work with depending on how much time you want them to spend on this project.

Creating a species and determining how common some genetic traits are going to be is a great way to make sure students have a solid understanding of the Punnett square. You can have students create illustrations for the different genetic combinations.

You can go further and ask students to create genetic traits for an imaginary species, determine which traits are dominant and recessive, and ask them to create problems that other students will have to solve.


A Guide to Implementing the Cornell Note Template System in Your Classroom

The Cornell note-taking system is designed to have students play a more active role in synthesizing and retaining information. You can start using a Cornell notes template in your classroom to prepare students for college or simply help them retain information more efficiently.

A Guide to Implementing the Cornell Note-Taking System in Your Classroom

The Cornell note-taking system was invented in the 1940s by a Cornell University professor named Walter Pauk. This system is designed to have students play an active part in structuring the information they learn in class. Here is how you can implement this note-taking methodology in your classroom.

The Benefits Of The Cornell Note-Taking System

The Cornell notes template is designed to organize information. This methodology requires students to go over their notes after each class so they can create a summary and add information in the study cues column.

This encourages students to play a more active role in the learning process. It’s a simple system that is easy to adopt.

There is a visual element that will help students retain information. This approach also helps students apply what they learn and develop strong synthesizing skills, which will be very valuable in college.

What Does The Cornell Notes Template Look Like?

cornell note taking

You can easily find a Cornell notes template online or teach your students to create one. All you have to do is separate a page in four sections with a shape that resembles a capital I. Keep in mind that the left-side column should be smaller than the right-side column.

You can easily adapt this template as needed. For instance, you could create an additional section for students to write down the new words they encounter during a lesson if you teach a foreign language.

Make sure students have a template ready ahead of a lesson so you can start right away with the lesson and have students take notes.

How To Use The Cornell Note-Taking System

The small section at the top of the page should be used to write down a few things about the lesson. Students might need to write down the name of the course, date, and the topic of the lesson. Let each student develop their system to keep track of their notes.

The right-side column is used to take notes during classes. This is something students should already be familiar with. Encourage them to develop their own system to keep track of what is important. You could recommend that they use different colors or underline important information.

At the end of each lesson, students should go over their notes and add some questions in the right-side column. These questions should help them go further and connect the material with other lessons. Finding some questions that will help them explore the topics discussed and go further will help them process the new information.

The left-side column of the page is the study cues column. This is a column students will need to fill out after each lesson. The purpose of the study cues is to summarize the main ideas and important concepts from the notes. Students should be able to hide the right-side column and use the study cues to recite the content.

Study cues should guide students as they learn and recite new material. Let students create their study cues since everyone has a different way of retaining new information.

The bottom section of the page is the summary section. Students should write a summary after going over their notes. Creating a summary helps students learn new information and retain it. The summaries will be helpful when students need to brush up on old material quickly.

Tips For Implementing The Cornell Note-Taking System

note taking

Using a Cornell notes template will help high school and college students. Younger students might not benefit from it. You can introduce the system in your classroom as long as students are used to taking notes on their own.

You might want to focus on introducing different methodologies to help your students take notes during lessons first. The additional elements introduced by the Cornell note-taking methodology might overwhelm students if they are struggling with taking notes.

The summary section of the template shouldn’t be an issue since students are used to synthesizing information. The study cue column will probably be the most difficult element of this methodology.

The study cue column should be unique to each student. However, you shouldn’t hesitate to provide a short list of key concepts that should appear in the study cue column if your students are new to using this methodology.

Extracting the most important study cues from the notes will become easier as students get used to using the left-side column to recite their notes. This will help them identify which cues are going to help them recall information.

Use these strategies to help your students adopt the Cornell notes template in your classroom. Don’t expect your students to change the way they learn things overnight. Set some realistic goals and focus on having students change their attitude towards learning and play a more active part in it by the end of the school year.

Introduce The Template Early In The School Year

It takes time for students to get used to finding the right study cues when going over their notes. Using this methodology also means that students will need to make time for going over their notes after each lesson.

It is best to introduce the Cornell note-taking methodology as early as possible in the school year. Students will have to organize their time right away to go over the notes after each lesson. Your students might not get all the benefits of this methodology right away, but they will have a new way to retain information by the end of the school year.

It will also take time for students to learn to come up with insightful questions to add to the right-side column and to figure out what to add to the study cues column. Don’t despair if these sections seem empty at the beginning of the school year!

Give Students Time To Go Over Their Notes In Class

Your goal should be to get students to go over their notes independently as early as possible in the school year. However, you should give them some time in class to go over their notes.

This is a great way to make sure everyone understands how the system works and it helps students get into the habit of going over their notes, asking questions, and finding study cues.

You could end each lesson by creating a summary together. The students who are behind with their synthesizing skills will get a better idea of how to extract important information from their notes.

Even though study cues should be unique to each student, you can have students share the study cues they have decided to use. This will help other students fill out this column if they have a hard time with identifying which important concepts should be added.

You could also make some time to have students come up with questions and ask them at the end of each lesson.

Assignments

You can turn the Cornell note-taking system into an assignment. This approach will help you save time in class and will help students get into the habit of going over their notes after each lesson. This could be a great way to help high school students get ready for college.

Dedicate a few minutes to checking the notes from the previous lesson at the beginning of every class. Make sure that every student took the time to write a summary, find study cues, and added some questions to their notes.

You could also have students come up with their questions and do some research to answer these questions as an assignment.

Another way to use this system as an assignment would be to pick a student at the beginning of each class, have them cover the right-side column of their note, and go over what was covered during the last class with the help of their study cues.

Encourage Reflection

Another advantage of this methodology is that it encourages students to connect new information with what they have already learned. Make sure you provide students with opportunities to make these connections.

Give students opportunities to give their notes and draw on previous knowledge when completing assignments or working on different activities in the classroom.

Everything you do in the classroom should be geared towards having students adopt a more active attitude. Encourage them to ask their questions and to find the answers by themselves. This is the kind of attitude that will help them succeed in college.

You can also find new ways to check on what students have learned. Let them keep their notes and ask some questions about material from previous lessons. The goal is to find the answer as quickly as possible in one’s notes!

The Cornell note-taking system is going to change the way your students think about learning. This methodology encourages students to be more active and to ask more questions. Try introducing it as early as possible in the school year, and make sure you dedicate enough time to helping students write good summaries and find helpful study cues.